Microarray Data Analysis III
Yan Cui (ycui2@uthsc.edu)
The address of this webpage:
http://compbio.uthsc.edu/microarray/lecture3.htm
Algorithms
for microarray data analysis
1)
Hierarchical clustering (output: gene clusters and sample clusters)
2)
K-means/medians clustering (output: gene clusters and sample clusters)
3)
T-test (output: a group of differentially expressed genes)
4)
SAM (output: a group of differentially expressed genes)
What to do with these lists of selected genes?
How to understand the biological meaning of your
gene list?
Start from the existing knowledge.
First, find out what are known about the genes in
the list.
GO provides no new biological knowledge, but it is a
new way of representing and organizing existing biological knowledge. It is a
standardized and computer-readable gene function classification system.
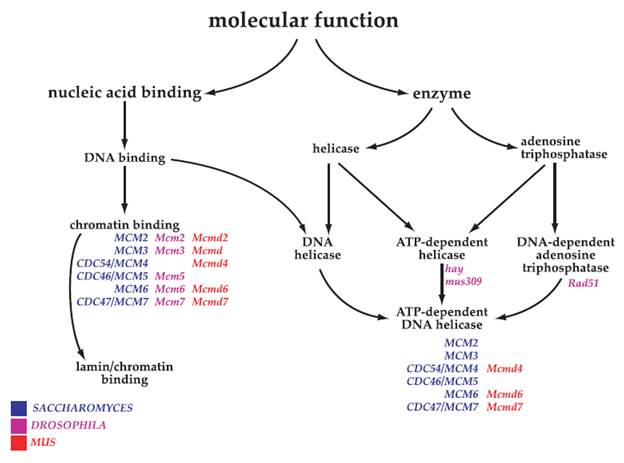
GO has a hierarchical structure, which is a Directed
Acyclic Graph (DAG).
Directed: A parent node and a child node are linked
by a directed edge (arrow) starting from the parent node and ending at the
child node. The parent node represents a broader functional category while the
child node represents a more specific functional category.
Acyclic: No directed cycle.

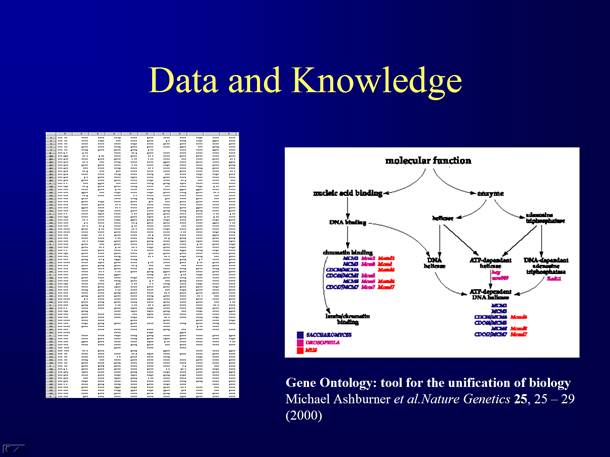
Gene Ontology: Unified Gene Function Classification
System for All Eukaryotes
Web-based Computational Tools for Gene Ontology -- Bridging the Gap between Microarray Data and Existing Biological Knowledge
Help you understand the gene lists from microarray analysis.

The
GeneInfo database
1. GeneInfoViz includes parser programs that can download and parse gene information from public databases such as UniGene, LocusLink and Gene Ontology.
2. The compiled gene information is then saved in our local database -- GeneInfo.
3. Currently, the GeneInfo database contains function information of genes of human, mouse, rat, fruit fly, and C. Elegan etc. More species will be added in the future.
Batch
retrieval of gene information
1. The input is a list of query genes.
2. Search by LocusLink IDs, UniGene
IDs, and official gene symbols.
3. Select evidence codes.
4. The output includes a short description
of gene function and Gene Ontology terms.
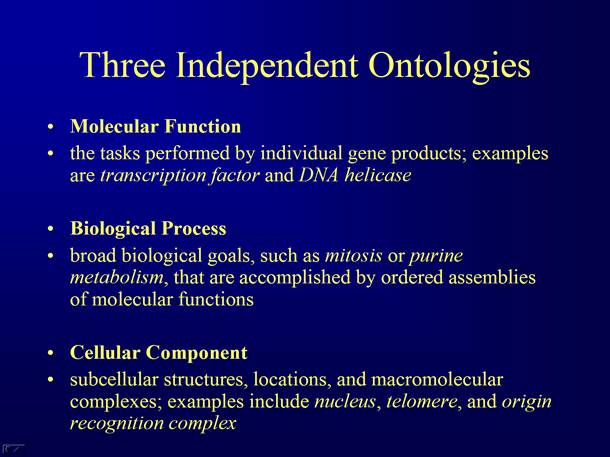
5. There are three types of GO terms:
biological process [P], molecular function [F], and cellular component [C].
6. Associations of genes with GO terms
are tagged with an evidence code that categorizes the source of the annotation,
e.g. electronic annotation, experimental evidence. Users can choose to exclude
the associations between genes and GO tagged with undesired evidence codes. By
default, the associations with any evidence code are included.
UPLOAD
GENE LIST
Potential markers for the prognosis of breast cancer, a set of genes differentially expressed between two groups of breast cancer patients with significantly different five year survival after chemotherapy.
The Gene List
NCBI Entrez Gene ID (or LocusLink ID)
1942 1956 2064 2625 3002 4485 4602 4605 4609 5327 6659 6662 6722 7494
Gene Symbols
EFNA1 EGFR ERBB2 GATA3 GZMB MST1 MYB MYBL2 MYC PLAT SOX4 SOX9 SRF XBP1
The
directed acyclic graphs of Gene Ontology
1. The GO system has a hierarchical
structure, the broader biological roles are at the higher levels, and more specific roles are at the
lower levels.
2. A DAG (Directed Acyclic Graph) is
used to display the hierarchical structure of Gene Ontology.
3. Each node represents a Gene Ontology
term.
4. A parent node and a child node are
linked by a directed edge (arrow) starting from the parent node and ending at
the child node.
5. GeneInfoViz filters the GO DAG and
only shows the part that is associated with the query genes.

Construction
and dynamic visualization of gene relation networks
Given all the information about the genes in the
databases, what can we say about the relationships between the genes?
For example, we want to know if the genes are related and how closely they are related based on the existing knowledge about their biological roles.
1. The results of batch query include
the GO terms that are associated with each gene.
2. GeneInfoViz starts from these GO
terms and traces the paths up to a higher level (determined by user) in the GO
DAG.
3. An indicator table is used to code
the genes’ biological roles. Only 1 and 0 occur in the indicator table:
"1" means the gene is associated with the biological role,
"0" means it is not.
4. Based on the indicator table, we can
construct an adjacency matrix. The distances between genes are determined by
the adjacency matrix. Basically, the more biological roles the two genes share,
the closer they are.
5. GeneInfoViz dynamically displays the gene relation network G using a Java Applet.
6. It makes a planar embedding of G in the two-dimensional space.
7. The program allows users to change the graph layout by clicking and dragging the vertices (genes). The program moves the vertices to keep the lengths of the edges in the network as close to L (the distance determined by the adjacency matrix) as possible.
Level 7

Level 8
DAVID
Functional Annotation Tool
DAVID: Database for Annotation, Visualization, and
Integrated Discovery, a web-based tool to provide functional interpretation of
lists of genes derived from genomic studies.
The wide-range collection of heterogeneous
functional annotations in the DAVID Knowledgebase
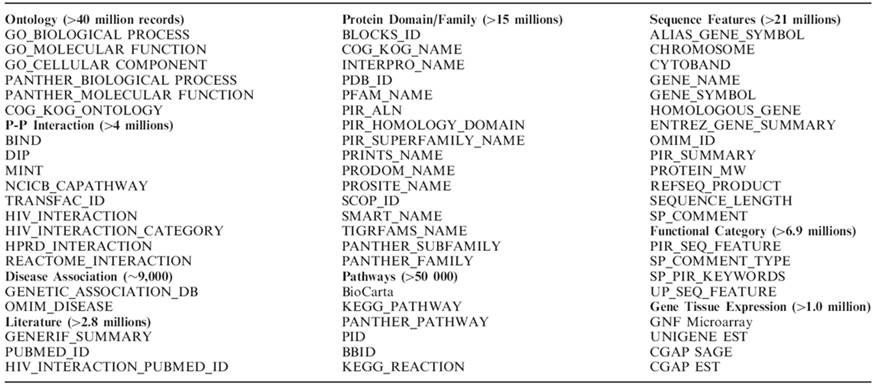
Form Huang DW et al. (2007) DAVID Bioinformatics Resources: Expanded annotation database and novel algorithms to better extract biology from large gene lists. Nucleic Acids Res. 35: W169-75.
UPLOAD GENE LIST
Potential markers for the prognosis of breast
cancer, a set of genes differentially expressed between two groups of breast
cancer patients with significantly different five year survival after
chemotherapy.
The Gene List
Entrez Gene ID (or LocusLink ID)
1942 1956 2064 2625 3002 4485 4602 4605 4609 5327
6659 6662 6722 7494
GENE_SYMBOL
EFNA1 EGFR ERBB2 GATA3 GZMB MST1 MYB MYBL2 MYC PLAT
SOX4 SOX9 SRF XBP1
Statistical models of enrichment (or over-representation)
|
Selected genes |
Non-selected genes |
|
|
Having function F |
N1 |
N2 |
|
Not having function F |
N3 |
N4 |
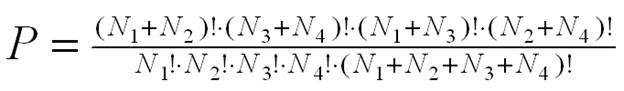
1. Fisher Exact Probability
The Fisher exact probability for enrichment is calculated
using the Gaussian hypergeometric probability distribution:
 .
.
A small Fisher exact probability (e.g. <0.05) means
the association between the gene list and function F is statistically
significant, therefore, function F is a biological theme of your gene list.
2. EASE Score (Adjusted Fisher Exact Probability)
The EASE score is a conservative adjustment to the
Fisher exact probability. It weights significance in favor of the association
supported by more genes.
For example, (Douglas A Hosack, et al. Identifying
biological themes within lists of genes with EASE. Genome Biology 2003,
4:R70).
206 genes is selected from a microarray of 13,679
genes,
Only one gene in the microarray belongs to a
function category, X,
And that gene happens to appear on the list of the
206 genes,
Fisher Exact Probability would be significant (p =
0.0152).
A more common function category, Y, with 787 members
in the microarray,
20 members on the list of 206 genes,
Fisher exact probability would be slightly less
significant (p = 0.0154).
A biological theme based on the presence of a single
gene is not stable and is rarely interesting.
If the single gene happens to be a false positive,
then the significance of the dependent theme is entirely false.
The EASE score is calculated by removing one gene
within category X from the list and calculating the resulting Fisher exact
probability for that category,
The EASE score for these two situations is p =
1 for category X and p < 0.0274 for category Y,
Thus the EASE score eliminates the significance of
the 'unstable' category X while only slightly affecting the significance of the
more global theme Y.
The EASE score penalizes the significance of
categories supported by fewer genes and thus favors more robust categories than
the Fisher exact probability.
Form Huang DW et al. (2007) DAVID Bioinformatics Resources: Expanded annotation database and novel algorithms to better extract biology from large gene lists. Nucleic Acids Res. 35: W169-75.
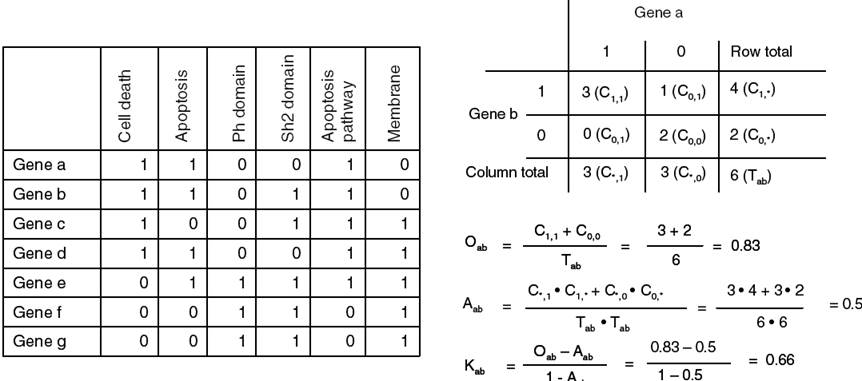
The kappa value represents the degree of
similarity between two binary strings.
What else can you do with the DAVID Knowledgebase?
Form Huang DW et al. (2007) DAVID Bioinformatics Resources: Expanded annotation database and novel algorithms to better extract biology from large gene lists. Nucleic Acids Res. 35: W169-75.
Further Reading
1.
The Gene Ontology Consortium. (2000) Gene Ontology: tool
for the unification of biology. Nat Genet 25: 25-29. [PubMed]
2.
The Gene Ontology Consortium. (2008) The Gene Ontology in
2010: extensions and refinements. Nucl. Acids Res. 38: D331-D335. [PubMed]
3.
Sherman BT, Huang DW, Tan Q, Guo Y, Bour S, Liu D, Stephens R,
Baseler MW, Lane HC, Lempicki RA. (2007) DAVID Knowledgebase: A Gene-centered
Database Integrating Heterogeneous Gene Annotation Resources to Facilitate
High-throughput Gene Functional Analysis. BMC Bioinformatics. 8:426.[PubMed]
4.
Huang DW, Sherman BT, Tan Q, Collins JR, Alvord WG, Roayaei J, Stephens
R, Baseler MW, Lane HC, Lempicki RA. (2007) DAVID Gene Functional
Classification Tool: A novel biological module-centric algorithm to
functionally analyze large gene list. Genome Biol. 8:R183. [PubMed]
5.
Huang DW, Sherman BT, Tan Q, Kir J, Liu D, Bryant D, Guo Y, Stephens R,
Baseler MW, Lane HC, Lempicki RA. (2007) DAVID Bioinformatics Resources:
Expanded annotation database and novel algorithms to better extract biology
from large gene lists. Nucleic Acids Res. 35: W169-75. [PubMed]
6.
Mi Zhou and Yan Cui (2004) GeneInfoViz: Constructing and visualizing
gene relation networks. In Silico Biology Vol.4 0026 [PubMed]
Homework
Due Date: Wednesday, March 3. Submit to Dr. Yan Cui via email
(ycui2@uthsc.edu). The solution will be
posted at http://compbio.uthsc.edu/MSCI814/Solution3.htm
on March 20.
(1) Use GeneInfoViz to display the GO tree (i.e. the
DAGs of Biological Process, Molecular Function and Cellular Component) that is
related to the list of Human genes.
Lmo1
Arnt2
M98339
Hoxb6
Mef2c
Miz1
Myf6
Nfatc2
Nmyc1
Pou2f3
Rxrg
Hmgcs1
Taf1b
Tcea1
Tcf12
Cops5
Send me the GO term(s), gene name(s) and evidence
code(s) at the lowest level of the DAGs of Biological Process and Cellular
Component. Do NOT send me the image files.
(2) Use DAVID to identify the major biological
functions associated with the list of Affymetrix probe-sets. What is the most
significant functional term (i.e. the term with the smallest p-value) for the
gene list? How many genes in the gene list are annotated to this term? What is
the enrichment score of the most significant annotation cluster?
102413_at
92910_at
102713_at
103445_at
104590_at
160912_i_at
102265_at
93075_r_at
103048_at
92933_at
94325_at
99041_at
101529_g_at
98981_s_at
93693_at
95460_at