Large Scale Gene Expression Data Analysis II
Yan Cui (ycui2@uthsc.edu)
The address of this webpage:
http://compbio.uthsc.edu/microarray/lecture2.htm
Two Algorithms for Identifying Differentially Expressed Genes
o
T-Test
o SAM: Significance Analysis
of Microarray Data
Why is it important to study differential gene expression?
Each
cell of an organism contains a complete copy of the organism's genome.
Cells
are of many different types and states, e.g. blood, nerve, and skin cells,
dividing cells, etc.
What
makes the cells different?
Differential gene expression, i.e., when, where, and in what quantity each
gene is expressed.
(Statistics for Microarray Data Analysis by Terry Speed)
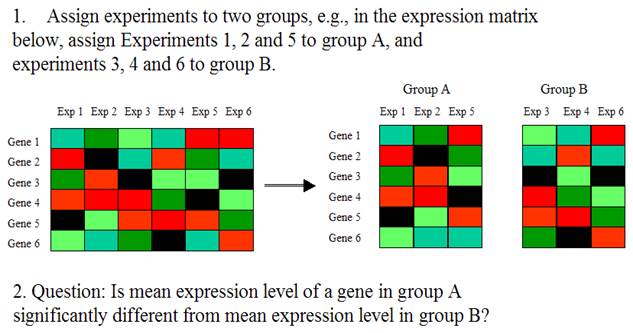
The differentially expressed genes are the genes whose expression levels are significantly different between two groups of experiments (or samples).
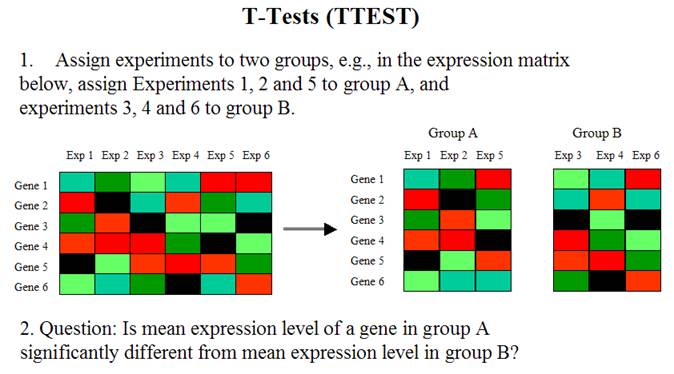
3. Calculate the observed t-statistic for each
gene
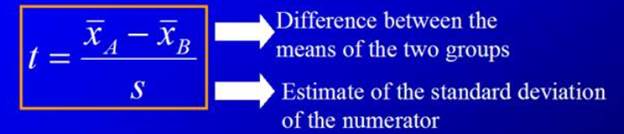
, where
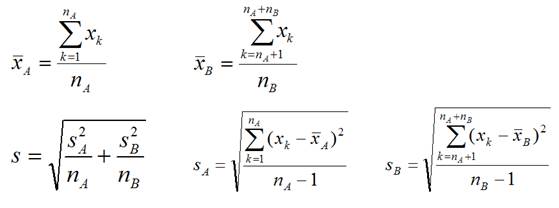
The T statistic is the distance between the two
groups in units of standard deviation.
4. Calculate probability
value (p-value, between 0 and 1) of the t-statistic for each gene using
t-distribution.
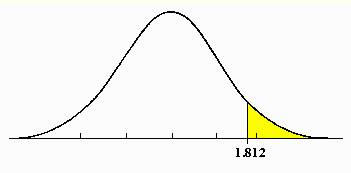
P=0.05
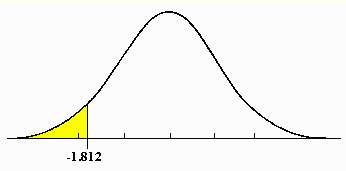
P=0.05
Summary:
Input: Expression matrix and
grouping for experiments
Output: A p-value for each gene. Small p-value = differential
expression.
SAM: Significance Analysis of Microarray Data
3. For each gene, compute d-value (analogous to t-statistic).
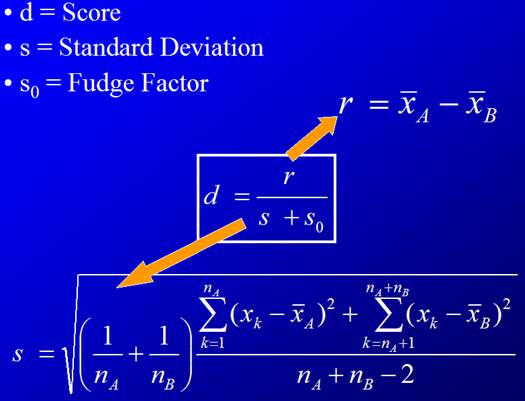
This is the observed d-value.
The![]() term is here to deal with cases when the variance gets too
close to zero (numerically stable).
term is here to deal with cases when the variance gets too
close to zero (numerically stable).
(Adapted from SAM: Significance Analysis of Microarray Data by Paul Delmar)
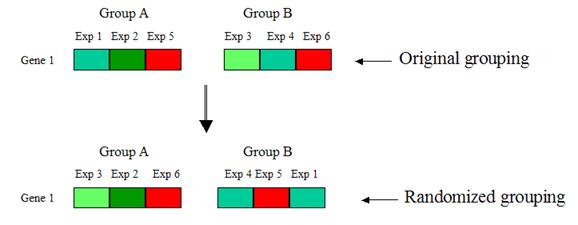
4. Permutation:
Randomly shuffle gene expression values between the two groups, such that the
reshuffled groups A and B respectively have the same number of elements as the
original groups A and B. Compute the d-value for each randomized grouping:
Repeat step 4 many times, so that each gene has many
randomized d-values. Take the average of the randomized d-values for each gene.
This is the expected d-value of that
gene.
Why permutation? Destroy any differential expression between the two groups. This would allow us to estimate the d-value when this is no differential expression (i.e. the expected d-value).
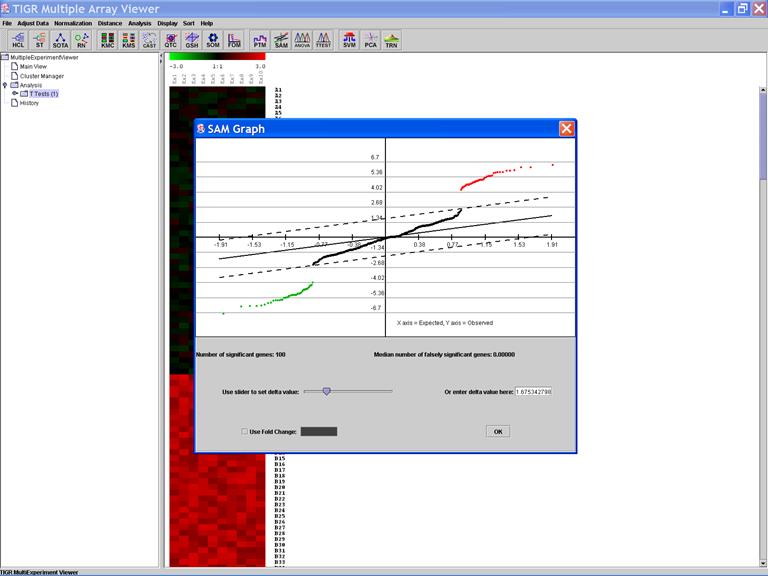
The
program plots
the observed d-values vs. the expected d-values (horizontal axis = the expected
d-values, vertical axis = observed d)
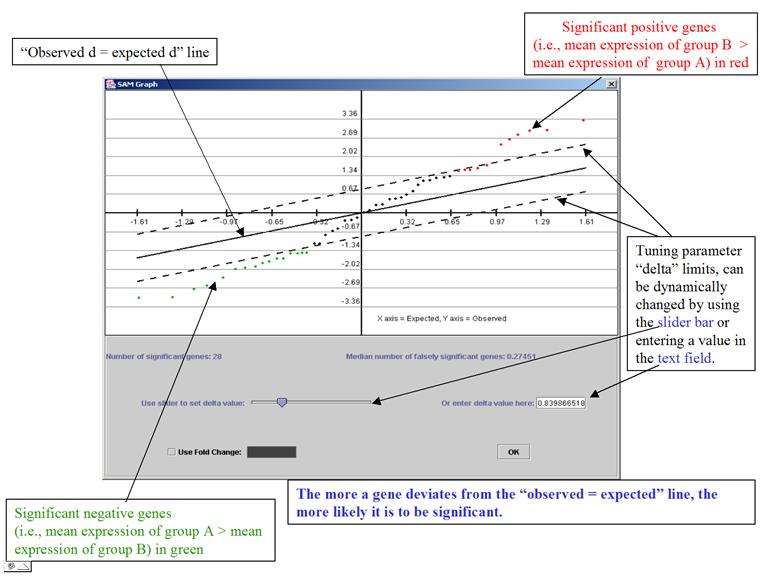
It is a very interactive algorithm – allows users to dynamically change thresholds for significance (by tuning parameter delta) after looking at the distribution of the d-value.
(Adapted from documentation of MeV)
Perform T-test and SAM with MeV
Data File: Stanford_Large.txt
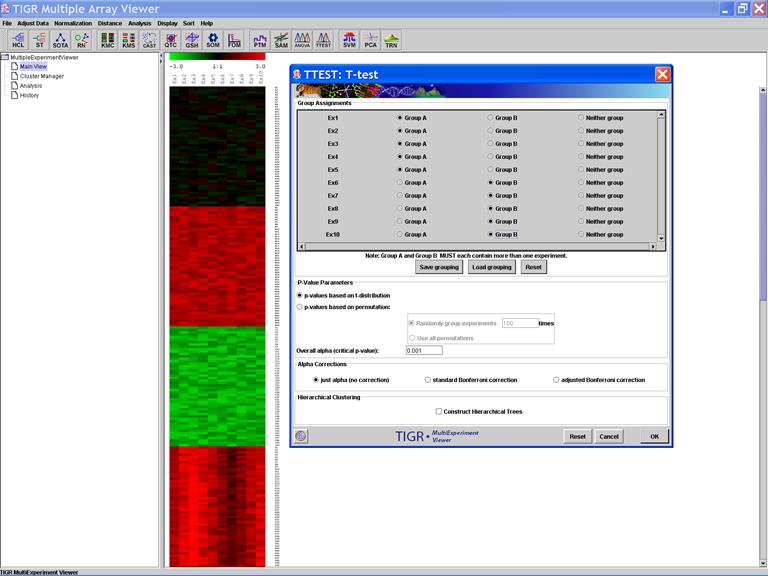
TTEST: T-test
Specify Options:
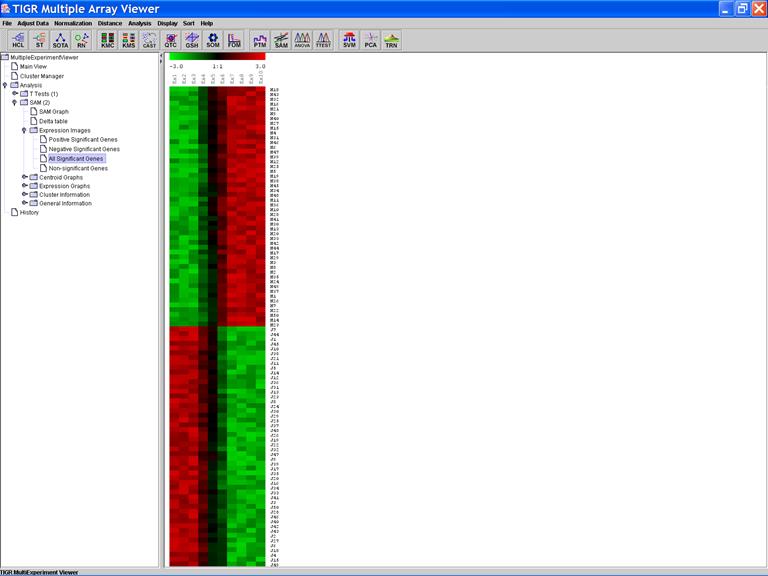
The Expression Image of the Significant Genes:
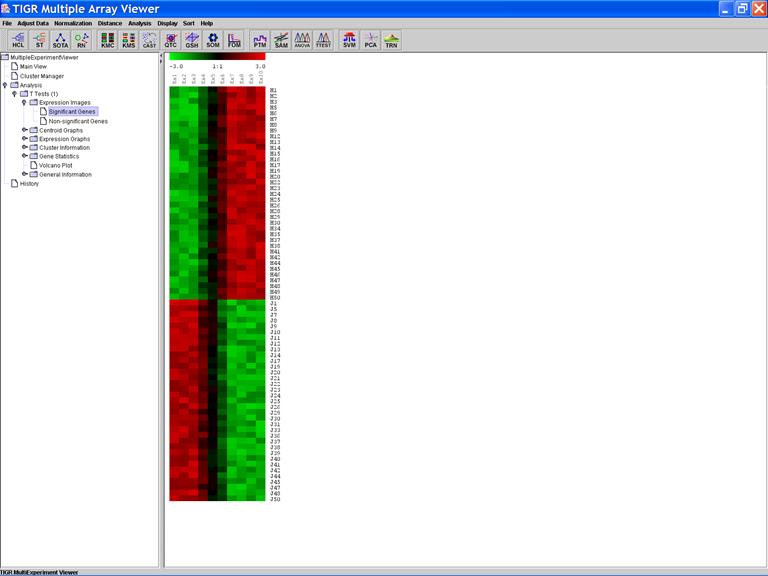
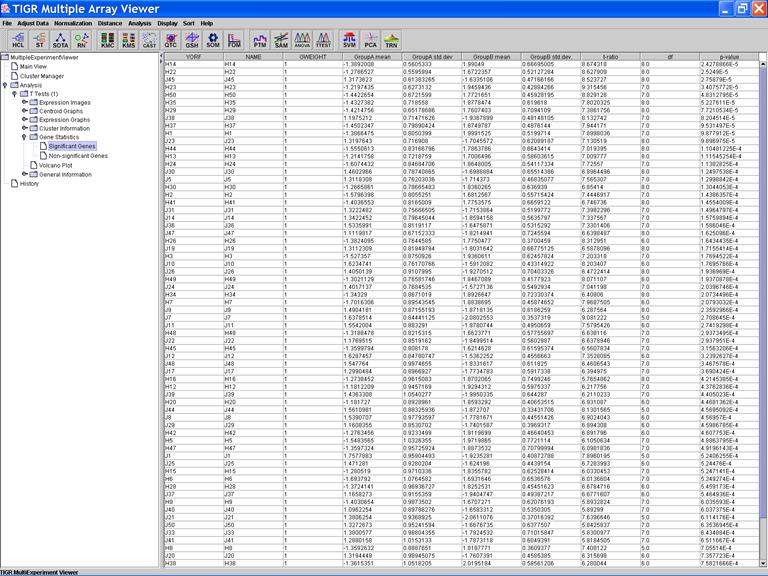
Click on the header of a column to sorting rows in ascending order based on the contents of the column
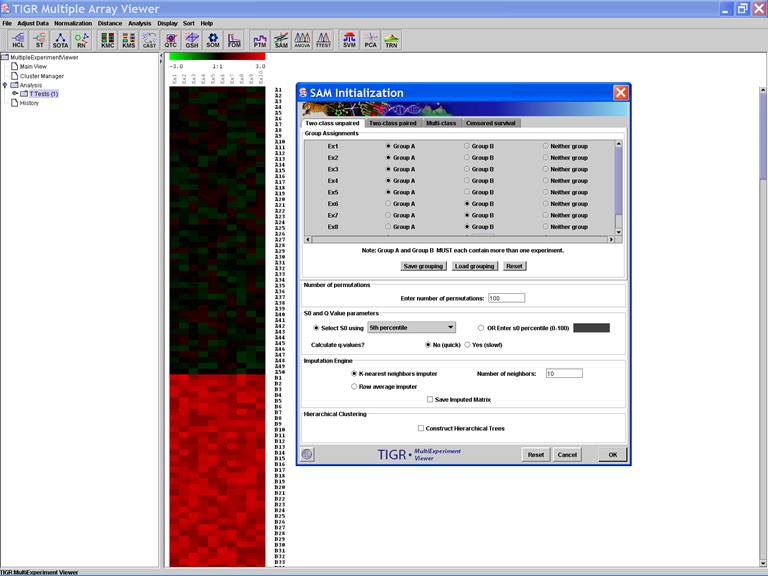
SAM: Significance Analysis of Microarray Data
Specify Options:
SAM Graph:
Significant Genes:
Algorithms for large scale gene
expression data analysis
1)
Hierarchical clustering (output: gene clusters)
2)
K-means/medians clustering (output: gene clusters)
3)
T-test (output: a group of differentially expressed genes)
4)
SAM (output: a group of differentially expressed genes)
5)
PTM (output: a group of genes matching the expression template)
What to do with these lists of selected genes?
How to understand the biological meaning of your
gene list?
Start from the existing knowledge.
First, find out what are already known about those
genes.
What is Ontology?
Ontology is the philosophical study of the nature of being, becoming, existence, or reality, as well as the basic categories of being and their relations. (Wikipedia)
In computer science and information science, an
ontology formally represents knowledge
as a set of concepts within a domain, using
a shared vocabulary to denote the types, properties and interrelationships
of those concepts. (Wikipedia)
Gene Ontology: A system of controlled vocabulary to describe gene functions and their relations
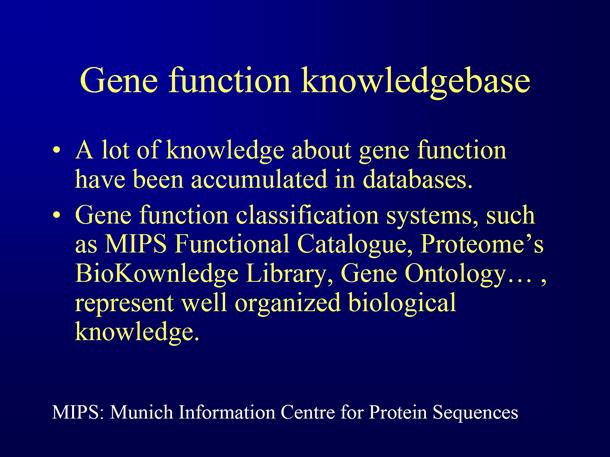
The purpose of
Gene Ontology is to make biological knowledge computable
Gene Ontology does not provide new biological
knowledge, but it is a new way of representing and organizing existing
biological knowledge. It is a standardized
and computer-readable gene function classification system.
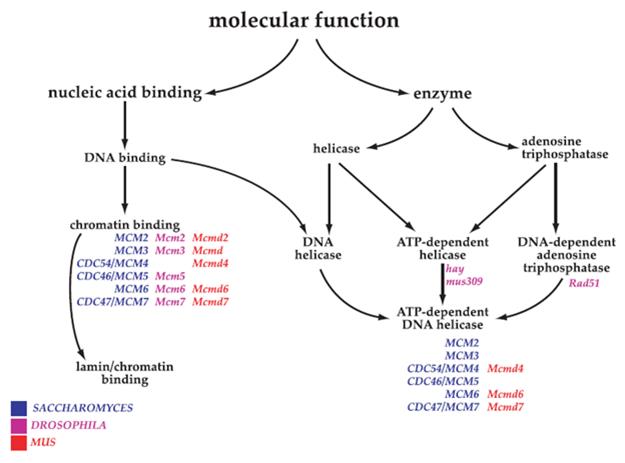
Gene Ontology has a hierarchical structure, which is
a Directed Acyclic Graph (DAG).
Directed: A parent node and a child node are linked
by a directed edge (arrow) starting from the parent node and ending at the
child node. The parent node represents a broader functional category while the
child node represents a more specific functional category.
Acyclic: No directed cycle. A node cannot be the
descendant of itself.
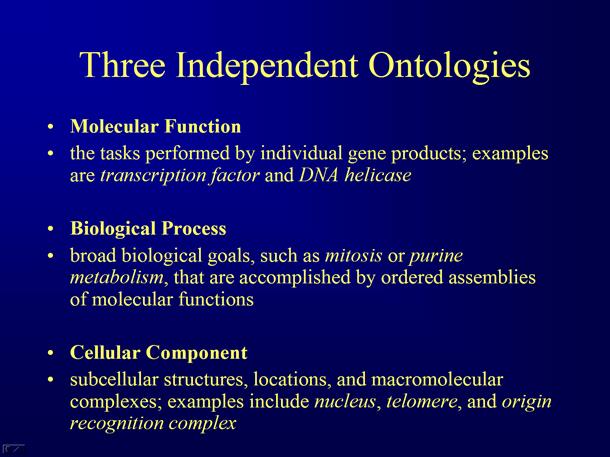
Unified Gene Function Classification System for All Organisms
The number of classes in the three Ontologies
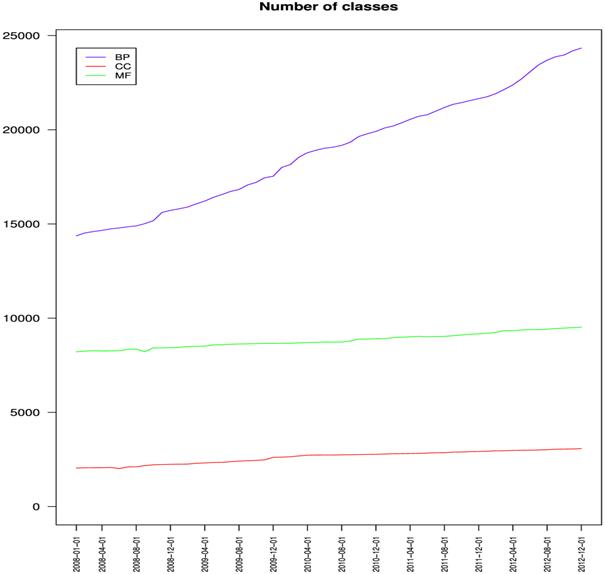
(from Dameron O, Bettembourg C, Le Meur N (2013) Measuring the Evolution of Ontology Complexity: The Gene Ontology Case Study. PLoS ONE 8: e75993)
Help you understand the gene lists from large scale gene expression analysis.
Link results from new data to existing knowledge

DAVID
Functional Annotation Tool
DAVID: Database for Annotation, Visualization, and
Integrated Discovery, a web-based tool to perform functional analysis of lists
of genes derived from genomic studies.
The wide-range collection of heterogeneous
functional annotations in the DAVID Knowledgebase

Form Huang DW et al. (2007) DAVID Bioinformatics Resources: Expanded annotation database and novel algorithms to better extract biology from large gene lists. Nucleic Acids Res. 35: W169-75.
Gene list
Potential markers for the
prognosis of breast cancer, a set of genes differentially expressed between two
groups of breast cancer patients with significantly different five year
survival after surgery and chemotherapy.
Gene Symbols
EFNA1 EGFR ERBB2 GATA3 GZMB
MST1 MYB MYBL2 MYC PLAT SOX4 SOX9 SRF XBP1
Statistical models of enrichment (or
over-representation)
|
Selected genes |
Non-selected genes |
|
|
Having function F |
N1 |
N2 |
|
Not having function F |
N3 |
N4 |
1. Fisher Exact Probability
The Fisher exact probability for enrichment is
calculated using the Gaussian hypergeometric distribution:
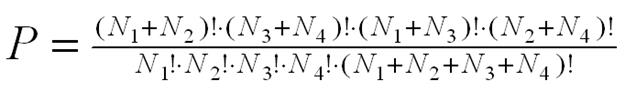 .
.
A small Fisher exact probability (e.g. <0.05)
means the association between the gene list and function F is statistically
significant, therefore, function F is a biological
theme of your gene list.
2. EASE Score (Adjusted Fisher Exact Probability)
The EASE score is a conservative adjustment to the
Fisher exact probability. It weights significance in favor of the association
supported by more genes.
For example, (Douglas A Hosack,
et al. Identifying biological themes within lists of genes with
EASE. Genome Biology 2003, 4:R70)
206 genes is selected from a microarray of 13,679
genes,
Only one gene in the microarray
belongs to a function category, X,
And that gene happens to appear on the
list of the 206 genes,
Fisher Exact Probability is significant (p = 0.015).
A larger function category, Y, with 787 members
in the microarray,
20 members on the list of 206 genes,
Fisher exact probability is also significant (p = 0.015).
A biological theme based on the presence of a single
gene is not stable.
If the single gene happens to be a false positive,
then the significance of the biological theme is entirely false.
The EASE score is calculated by removing one gene
within category X from the list and calculating the resulting Fisher exact
probability for that category,
The EASE score: p = 1 for category X and p
= 0.027 for category Y,
Thus the EASE score eliminates the significance of
the 'unstable' category X while only slightly affecting the significance of the
more global theme Y.
The EASE score favors more robust biological themes of
the gene list.
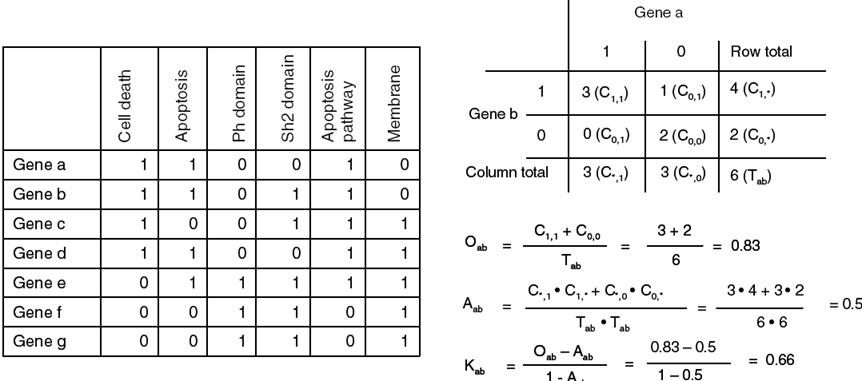
Functional
Annotation Clustering
Similar function categories are grouped together
Form Huang DW et al. (2007) DAVID Bioinformatics Resources: Expanded annotation database and novel algorithms to better extract biology from large gene lists. Nucleic Acids Res. 35: W169-75.
The kappa value represents the degree of
similarity between two binary strings.
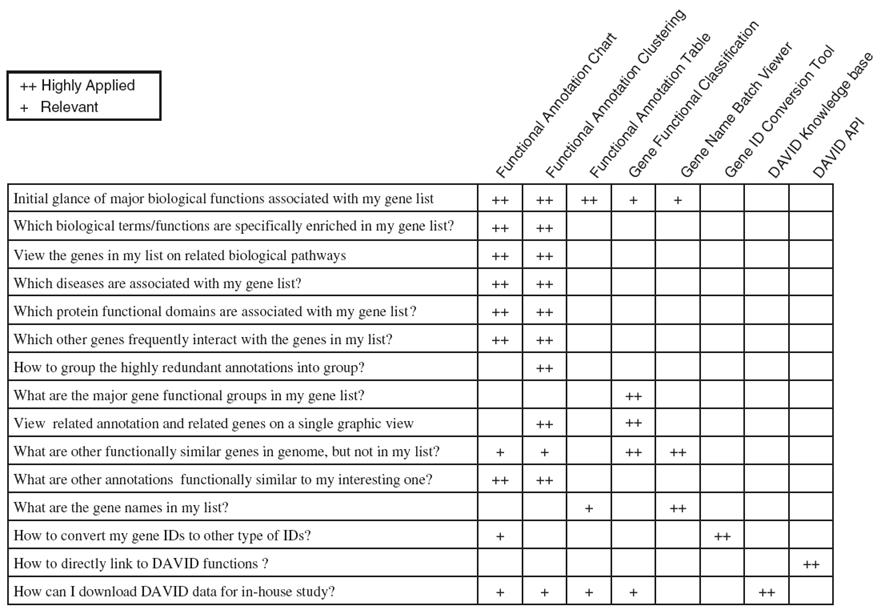
What else can you do with the DAVID Knowledgebase?
Form Huang DW et al. (2007) DAVID Bioinformatics Resources: Expanded annotation database and novel algorithms to better extract biology from large gene lists. Nucleic Acids Res. 35: W169-75.
Further Reading
1.
Pan, W. (2002) A comparative review of statistical methods for
discovering differentially expressed genes in replicated microarray
experiments. Bioinformatics 2002 18: 546-554.
2.
Cui, X. and Churchill, G.A. (2003) Statistical tests for differential
expression in cDNA microarray experiments. Genome Biology 4:210.
3.
Stockburger D.W., The t distribution, http://www.psychstat.missouristate.edu/introbook/sbk24.htm
4.
The Gene Ontology Consortium. (2013) Gene Ontology
Annotations and Resources. Nucl. Acids Res. 41:
D530-D535.
5.
Huang DW, et al. (2007) DAVID Gene Functional Classification Tool: A
novel biological module-centric algorithm to functionally analyze large gene
list. Genome Biol. 8:R183.
6.
Huang, D. W., B. T. Sherman, and R. A. Lempicki.
(2009) Systematic and integrative analysis of large gene lists using DAVID
bioinformatics resources. Nat. Protocols 4: 44-57.
Homework
Due Date: February 25. Submit to Dr. Yan Cui via email (ycui2@uthsc.edu).
Data: Download the dataset from http://compbio.uthsc.edu/MSCI814/Homework2.txt
(Right click on the link and select Save Target As).
The dataset contains gene expression profiles of 8 breast cancer samples
(BC1-8) and 8 ovarian cancer samples (OC1-8).
1.
Identify the genes that are differentially
expressed between the two groups (8 breast cancer samples vs. 8 ovarian
cancer samples) using:
a.
T-test
o How many significant genes
are identified (using the default options)?
o Which gene has the smallest
p-value?
b.
SAM
o Which gene has the largest ![]() (the absolute value of observed score (d))?
(the absolute value of observed score (d))?
2.
Identify the genes that match to the template expression pattern using:
a.
PTM
o
Use the gene identified in question 2a (i.e. the gene with the largest ![]() in SAM analysis) as template. How many genes match to this
template (set p=0.001)?
in SAM analysis) as template. How many genes match to this
template (set p=0.001)?
3.
Use DAVID to
identify the major biological functions associated with the list of Affymetrix microarray probe-sets (mouse data). What is the
most significant functional term (i.e. the term with the smallest p-value) for
the gene list? How many genes in the gene list are annotated to this term? What
is the enrichment score of the most significant annotation cluster?
102413_at
92910_at
102713_at
103445_at
104590_at
160912_i_at
102265_at
93075_r_at
103048_at
92933_at
94325_at
99041_at
101529_g_at
98981_s_at
93693_at
95460_at