Large Scale Gene Expression Data Analysis I
Yan Cui (ycui2@uthsc.edu)
The address of this webpage:
http://compbio.uthsc.edu/microarray/lecture1.htm
Two Algorithms for Clustering Analysis
o Hierarchical clustering
o K-Means / K-Medians
clustering
One Algorithm for Gene Expression Pattern
Matching
o PTM: Pavlidis
Template Matching
Software
o MultiExperiment Viewer (MeV)
Currently,
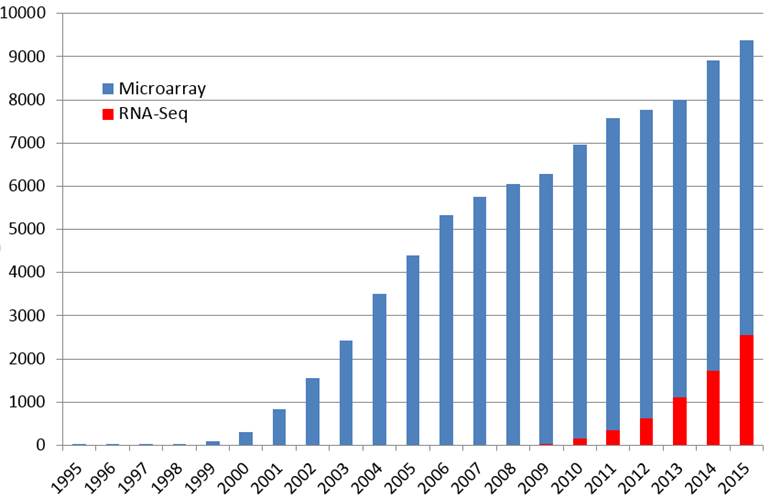
there are two types of methods for large-scale gene expression profiling
o
Microarray
o
RNA-sequencing (RNA-seq)
What is Microarray?
A microarray is a collection of small DNA spots attached to a solid surface. In microarray experiments, the signal collected from each spot is used to estimate the expression level of a gene. A microarray contains thousands of DNA spots, covering almost every gene in a genome.
o
The first high-throughput technology for gene expression analysis
o
Emerged in late 90s
https://www.youtube.com/watch?v=VNsThMNjKhM
What is RNA-Sequencing
(RNA-seq)?
o
A newer method for large scale gene expression analysis
o
Occurred a few years ago
o
Uses deep-sequencing technologies to measure the numerical frequencies
of RNA sequences in a sample
o
More accurate, more expensive
Microarray and RNA-Seq use very different technologies. Both of them can monitor expression levels of thousands of
genes simultaneously.
The number of published papers referring to microarray or RNA-seq (in their titles or abstracts)
Expression Data Matrix
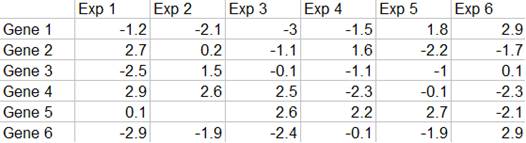
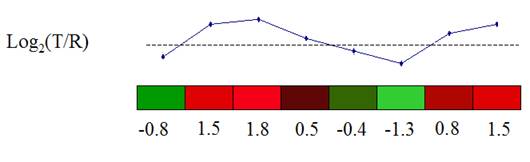
Gene expression data are usually presented in an expression matrix. Each column represents all the gene expression levels from a single experiment, and each row represents the expression of a gene across all experiments. Each element is a log ratio. The log ratio is defined as log2 (T/R), where T is the gene expression level in the testing sample, R is the gene expression level in the reference sample.
Why log transformation? It is easier to link log ratio to fold change.
|
Original ratio |
Log2-tranformed ratio |
||
|
Up |
Down |
Up |
Down |
|
2 |
0.5 |
1 |
-1 |
|
4 |
0.25 |
2 |
-2 |
|
8 |
0.125 |
3 |
-3 |
|
16 |
0.0625 |
4 |
-4 |
The expression matrix can be presented as a matrix of colored rectangles. Each rectangle represents an element of the expression matrix.
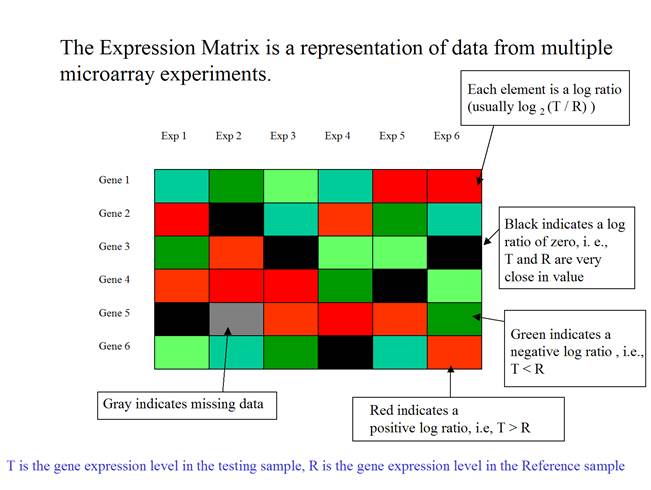
(Adapted from MeV
document)
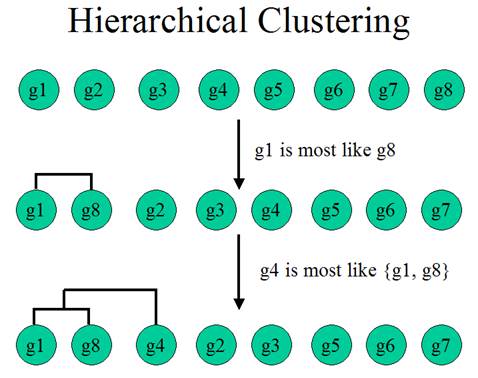
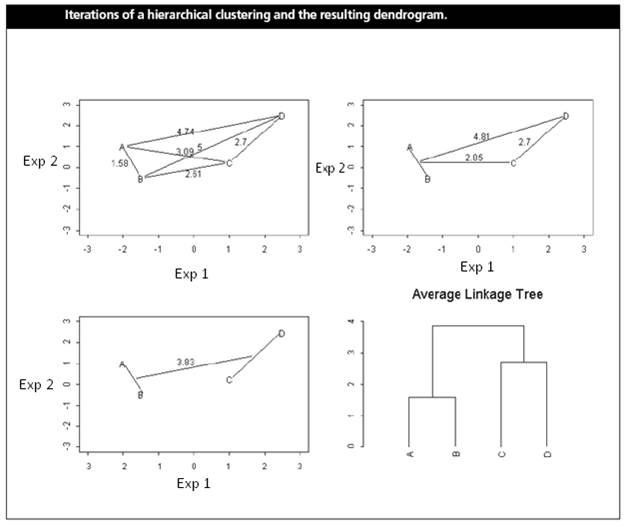
Hierarchical Clustering
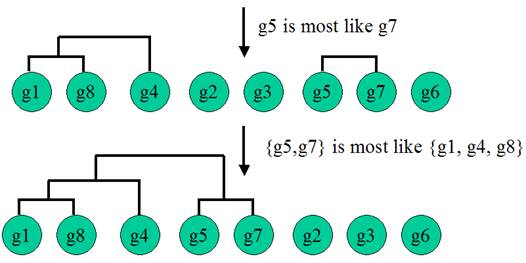
Hierarchical Clustering is the most popular method for gene expression data analysis. In hierarchical clustering, genes with similar expression patterns are grouped together and are connected by a series of branches (clustering tree or dendrogram). Experiments with similar expression profiles can also be grouped together using the same method.
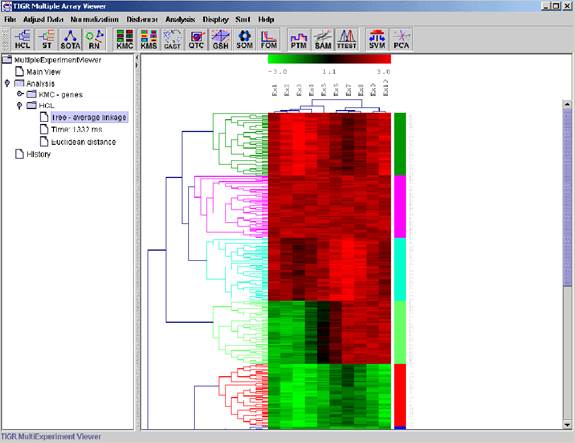
(Adapted from the documentation of MeV)
The two questions:
1.
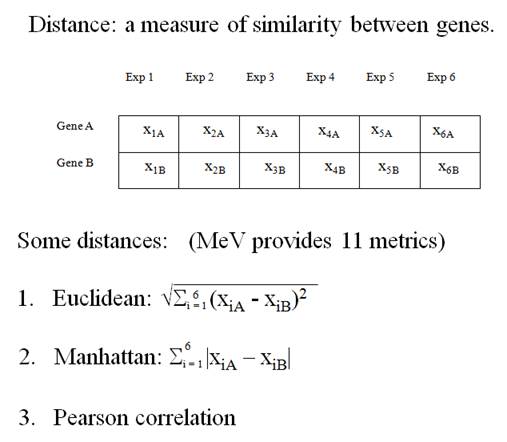
How to determine the similarity between two genes?
2.
How to determine the similarity between two clusters?
To answer the first
question, we calculate the distance between two expression vectors. A Gene Expression Vector consists of the
expression of a gene over a set of experimental conditions.
(From the documentation of MeV)
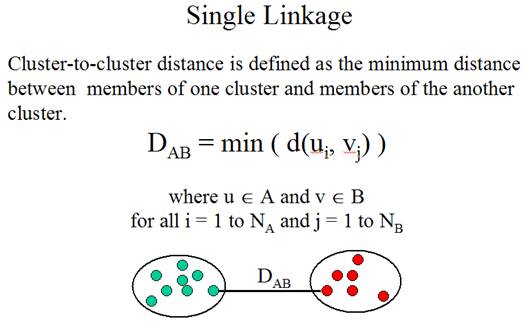
The second question is: How
to determine the similarity between clusters? The method for determining
cluster-to-cluster distance is called linkage method.
Three linkage methods:
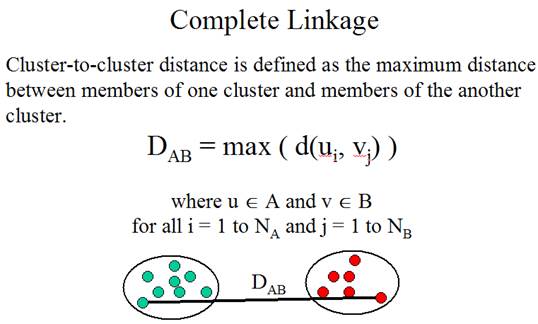
(Adapted from the documentation of MeV)
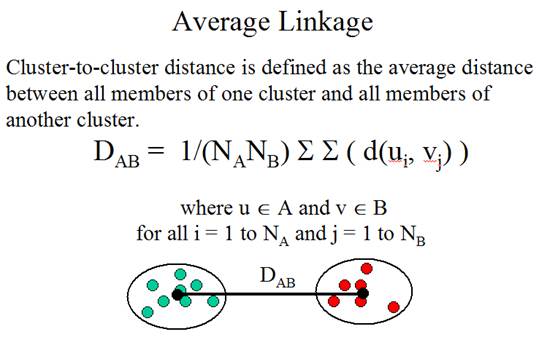
There is no theoretical
guideline for selecting the best linkage method. In practice, people almost
always use the average linkage method.
(Shannon W. et al. (2003) Analyzing microarray data using cluster analysis. Pharmacogenomics 4:41-51.)
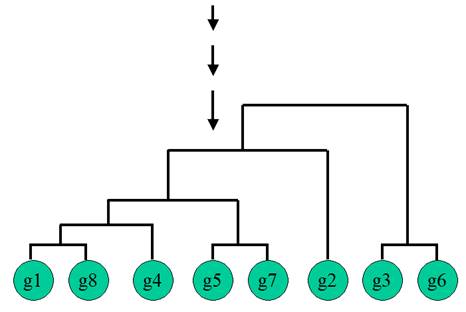
Gene A and B are merged
first at the level of 1.58. The position of the splitting point shows the
distance between two genes (or clusters). A low splitting point means short
distance and high similarity.
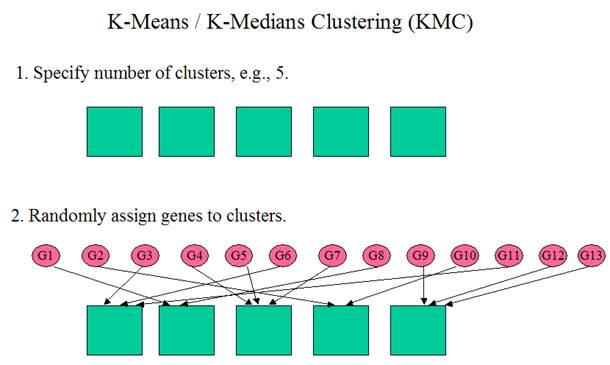
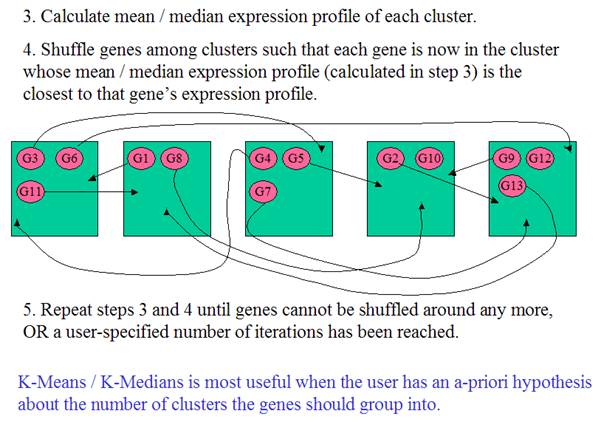
K-Means / K-Medians Clustering
What is Mean? What is
Median?
Mean is the average.
Median is the middle number, i.e. the middle of the
distribution. For an odd number of numbers, the median is simply the middle
number. For example, the median of 2, 4 and 7 is 4.
For an even number of
numbers, the median is the average of the two middle numbers. Thus, the median
of the numbers 2, 4, 7, 12 is (4+7)/2 = 5.5.
Median is more robust against outliers
For example, the mean of 5, 6, 7, 8 and 9 is 7. The
median of 5, 6, 7, 8 and 9 is also 7.
But, the mean of 5, 6, 7, 8 and 99 is 25, while the
median of 5, 6, 7, 8 and 99 is still 7.
(Adapted from MeV
documentation)
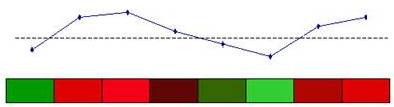
Template
Matching
Search for gene with similar expression patterns to
a template expression vector
1.
Specify a template expression vector
2.
Calculate correlation between
the template and each gene in the data set
3.
Search for genes with similar expression pattern to the template (i.e.
high correlation)
Template matching is particularly useful when the
researcher is searching for genes with a specific expression pattern.
(Adapted from MeV
documentation)
MultiExperiment Viewer (MeV)
MeV is an open source software for large scale gene
expression data analysis. It is distributed under The Artistic License, which
means you can freely download the software or get a copy from another user.
Run MeV
Double click the batch file (TMEV.bat) to start the
program. Use the File menu to open a new Multiple Array Viewer.
Load Data
Select Load data from the File menu to
launch the file-loading dialog. At the top of this dialog, use the drop-down
menu to select the type of expression files to load. Use the file browser to
locate the files to be loaded.
Name of the Input file: Example_large.txt (Download
from http://compbio.uthsc.edu/microarray/MeV/Data/)
Select Two-color Array and uncheck Load Annotation
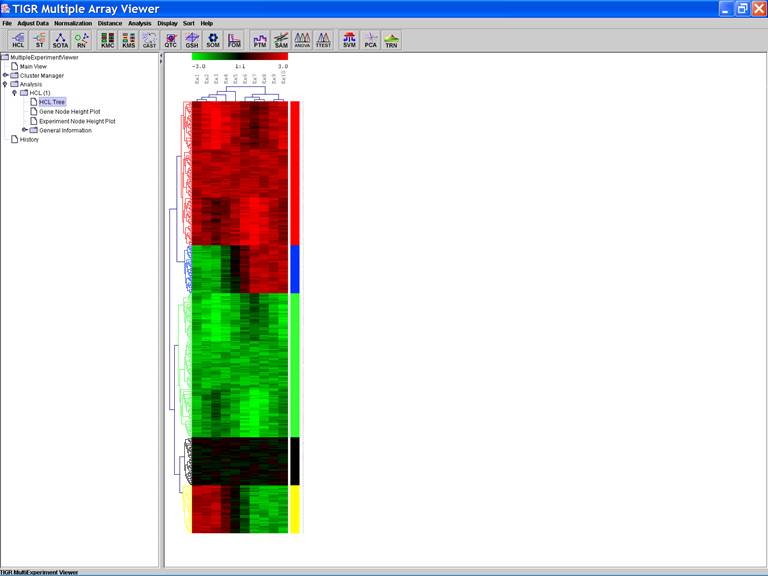
HCL: Hierarchical clustering
1.
Cluster both genes and samples
2.
Euclidean Distance
3.
Average Linkage
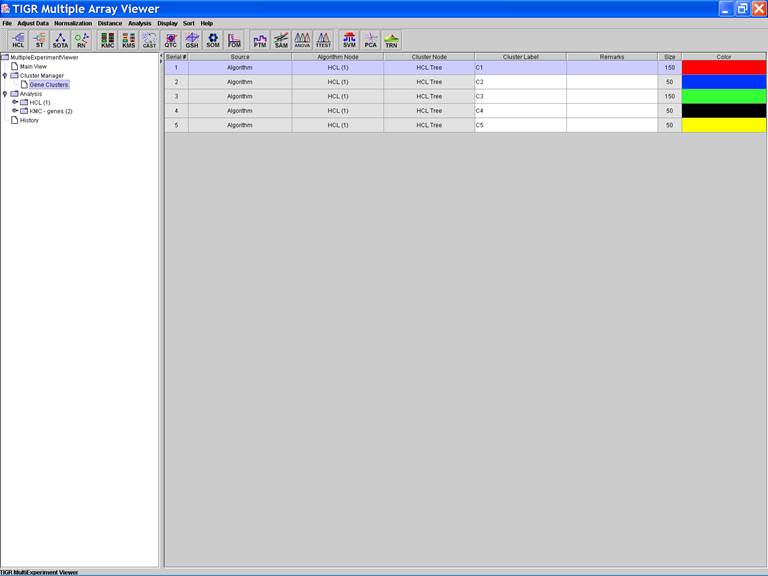
Define, store and annotate clusters
Clusters of interest can be stored:
1.
Click the dendrogram to select the cluster;
2.
Open a menu by right clicking in the viewer and selecting the store
cluster option
3.
Input the name of the cluster and select a color to label the cluster
A color bar is displayed along the right side of
cluster
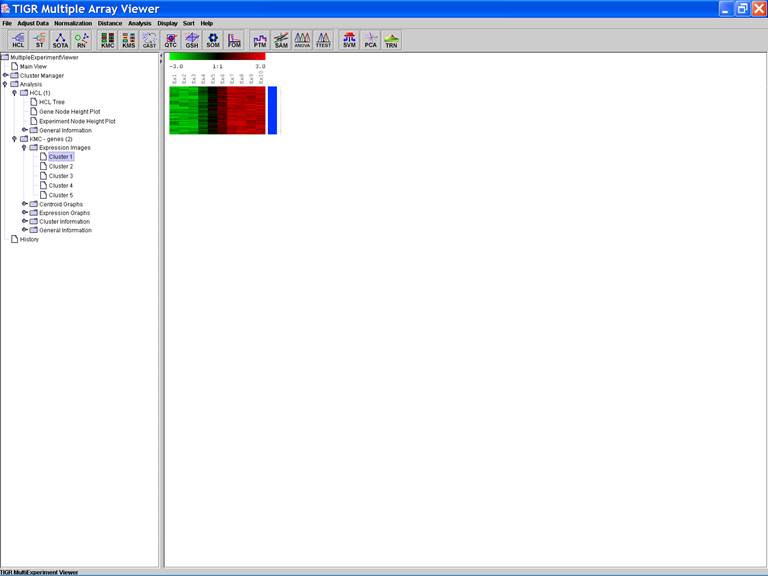
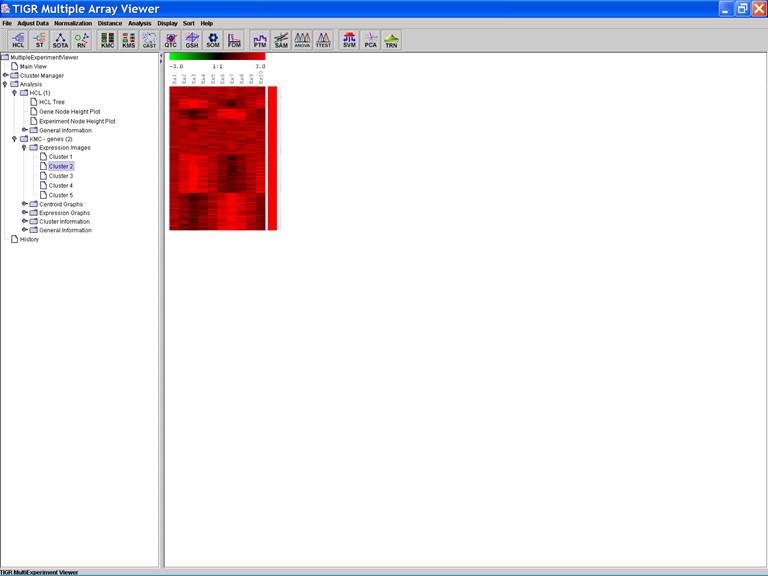
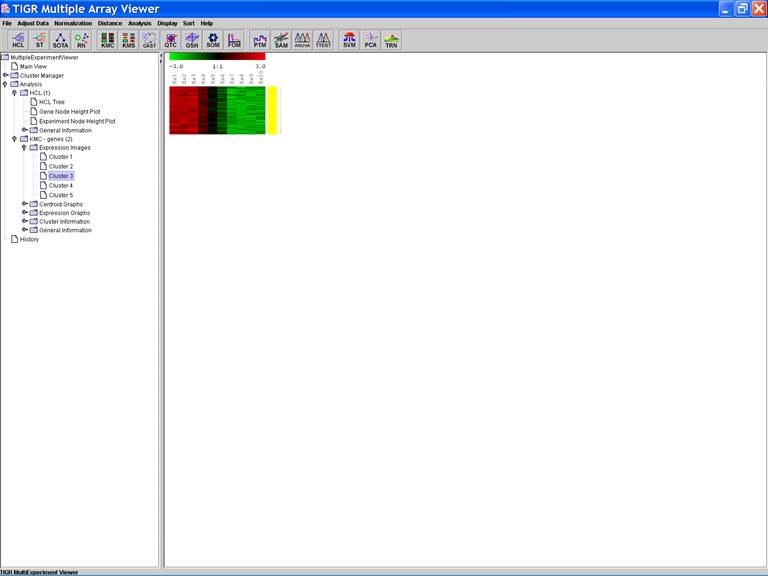
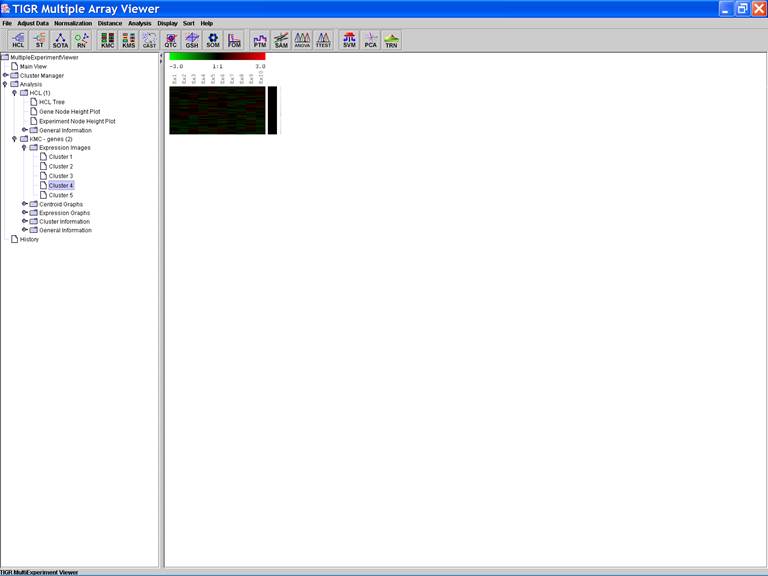
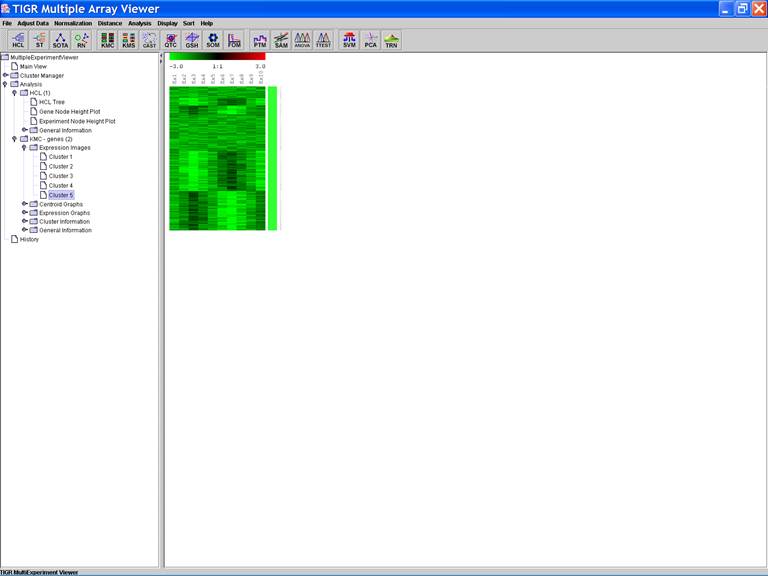
KMC: K-Means / K-Medians Clustering
Options:
1.
Cluster genes
2.
Euclidean Distance
3.
Use mean
4.
Number of clusters = 5
5.
Number of iterations = 50
Template
matching
Further Reading
The Nature Genetics special issues on
microarray analysis: The Chipping Forecast I, II, III
The Nature
Reviews Genetics article series of Applications
of next generation sequencing
Homework
Due Date: February 17. Submit to Dr. Yan Cui via email (ycui2@uthsc.edu).
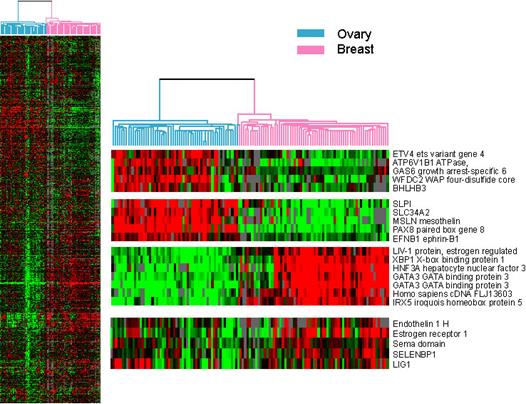
Background: Microarray has shown great promise in studying complex
diseases such as cancer. The genome-wide gene expression profiles of tumor
tissues are considered as the molecular
portraits of various cancers. For example, Clustering of breast and ovarian carcinoma
cases is shown in the figure below, 68 breast and 57 ovarian cases were
co-clustered to discern both similarities and disparities between the two
sample sets. The common reference control consisting of equal amounts of mRNA
from 11 human cancer cell lines. (Schaner, M et al., Gene Expression
Patterns in Ovarian Carcinomas, Mol Biol Cell. 2003 Nov;14:4376-86).
Data: Download the dataset from http://compbio.uthsc.edu/MSCI814/Homework1.txt
(Right click on the link and select Save
Target As). The dataset contains gene expression profiles of 16 tumor
samples. Each of the 16 samples is associated with one of
the two cancers.
1. Analyze
the data with hierarchical clustering (HCL)
You should use average linkage method, Euclidean
distance metric and only cluster experiments.
Please infer from the dendrogram
(clustering tree) the two groups of the samples (each associated with a type of
cancer).
For example,
Cancer 1: Sample 1, 3,5,7,9,11,13,15
Cancer 2: Sample 2,4,6,8,10,12,14,16
2. Analyze the data with
K-means clustering (KMC)
Use K-means clustering method (Euclidean distance
metric) to group the 16 samples into two clusters.
For example,
Cluster 1: Sample 1, 3,5,7,9,11,13,15
Cluster 2: Sample 2,4,6,8,10,12,14,16
What should be included in the email:
1. HCL
Cancer 1: Sample…
Cancer 2: Sample…
2. KMC
Cluster 1: Sample…
Cluster 2: Sample…