Microarray Data Analysis II
Yan Cui (ycui2@utmem.edu)
The address of this webpage:
http://compbio.utmem.edu/microarray/lecture2.htm
or
http://compbio1.utmem.edu/microarray/lecture2.htm
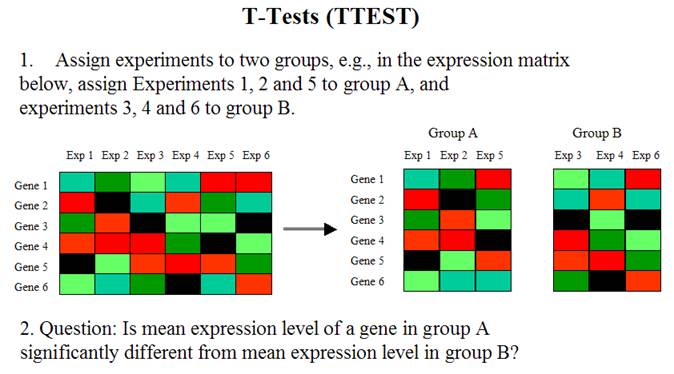
Identification of Differentially Expressed Genes
Each cell of an organism contains a complete copy of the organism's
genome.
Cells
are of many different types and states, e.g. blood, nerve, and skin cells,
dividing cells, etc.
What
makes the cells different?
Differential gene expression, i.e., when, where, and in what quantity each gene is expressed.
(Statistics for Microarray Data Analysis by Terry Speed)
The differentially expressed
genes are the genes whose expression levels are significantly different between
two groups of experiments (or samples).
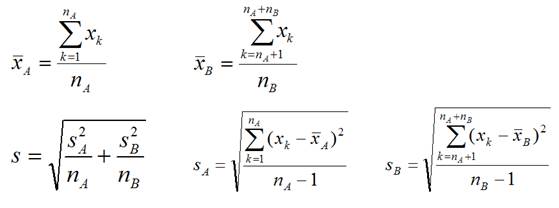
3. Calculate the observed t-statistic for each
gene

, where
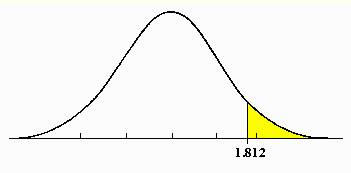
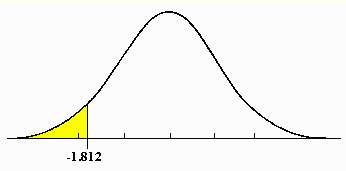
4. Calculate probability
value (p-value) of the t-statistic for each gene from t-distribution.
The output of the analysis: A p-value for each gene.
The p-value is the chance of getting the t-statistic as
or more extreme than the observed one, under the hypothesis of no
differential expression (null hypothesis). A small p-value indicates
that the hypothesis of no differential expression is not true and the gene is
differentially expressed.
SAM: Significance Analysis of Microarray Data
The purpose of this analysis is also to pick out genes whose expression level is significantly different between two groups of samples.
3. For each gene, compute d-value (analogous to t-statistic).
This is the observed d-value.
The![]() term is here to deal with cases when the variance gets too
close to zero (numerically stable).
term is here to deal with cases when the variance gets too
close to zero (numerically stable).
(Adapted from “SAM: Significance Analysis of Microarray Data” by Paul Delmar)
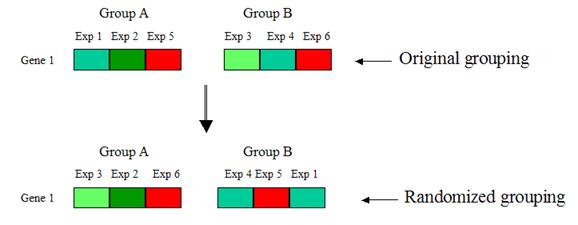
4. Randomly shuffle the values of the gene between
groups A and B, such that the reshuffled groups A and B respectively have the
same number of elements as the original groups A and B. Compute the d-value for
each randomized grouping:

Repeat step 4 many times, so that each gene has many
randomized d-values. Take the average of the randomized d-values for each gene.
This is the expected d-value of that
gene.
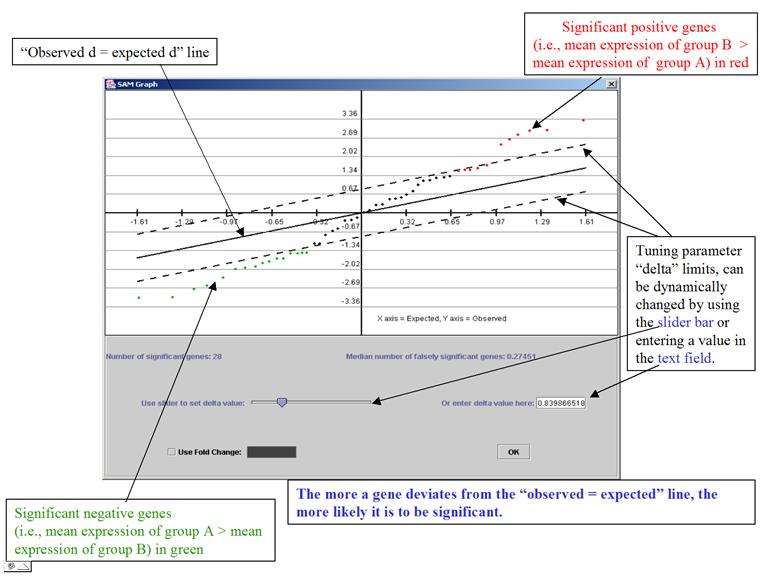
The
program plots
the observed d-values vs. the expected d-values (horizontal axis = the expected
d-values, vertical axis = observed d)

It is a very interactive algorithm – allows users to dynamically change thresholds for significance (through the tuning parameter delta) after looking at the distribution of the d-value.
(Adapted from documentation of MeV, http://www.tigr.org/software/tm4/mev.html)
Perform T-test and SAM analysis with MeV
Data File: Stanford_Large.txt
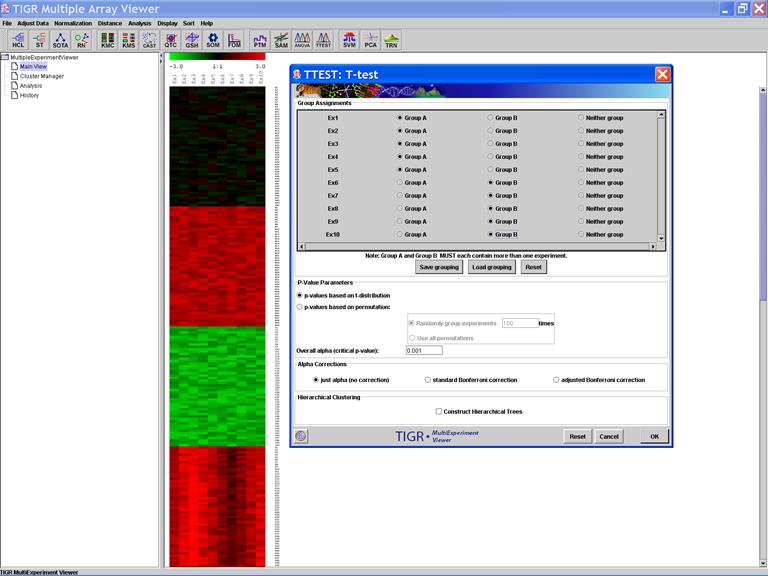
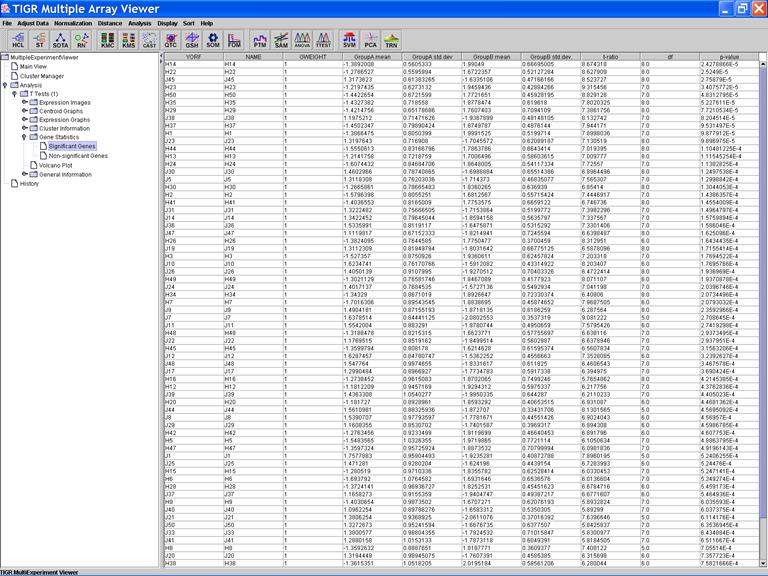
TTEST: T-test
Specify Options:
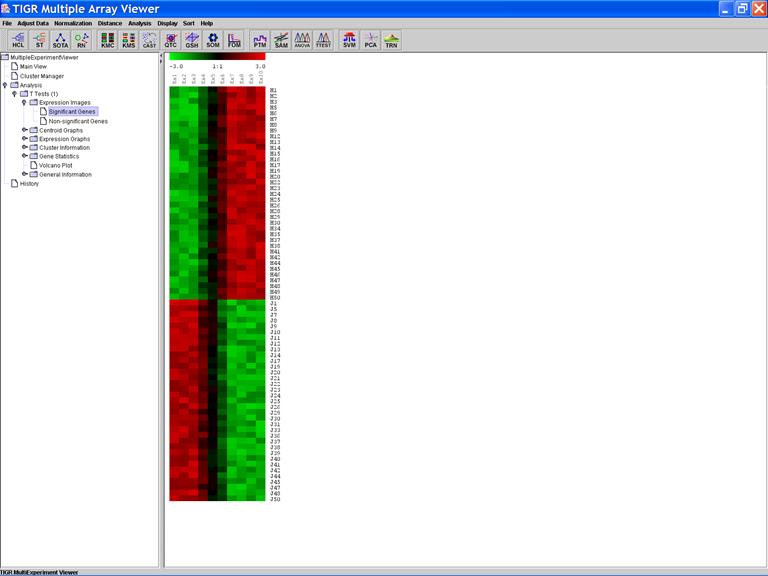
The Expression Image of the Significant Genes:
Click on the header of a column to sorting rows in ascending order based on the contents of the column
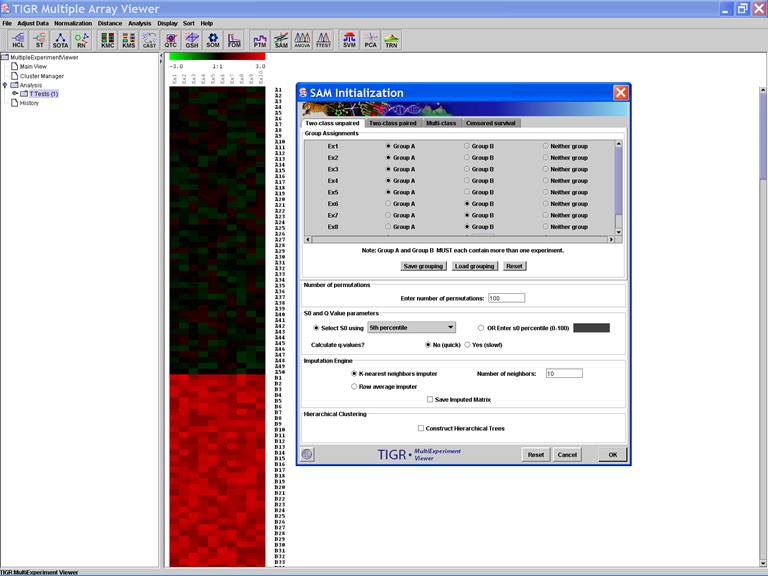
SAM: Significance Analysis of Microarray Data
Specify Options:
SAM Graph:
Significant Genes:
Further Reading
1.
Pan,
W. (2002) A comparative review of statistical methods for discovering
differentially expressed genes in replicated microarray experiments.
Bioinformatics 2002 18: 546-554. (http://bioinformatics.oupjournals.org/cgi/reprint/18/4/546.pdf)
2.
Cui,
X. and
Churchill, G.A. (2003) Statistical tests for differential expression in cDNA
microarray experiments. Genome Biology 4:210. (http://www.pubmedcentral.gov/picrender.fcgi?artid=154570&blobtype=pdf)
3.
Stockburger
D.W., The t distribution, http://www.psychstat.missouristate.edu/introbook/sbk24.htm
Public Microarray Databases
Stanford
Microarray Database (cDNA microarray)
Gene
Expression Omnibus (Multiple platforms)
Homework
Due Date: Wednesday, March 22. Submit to Dr. Yan Cui via
email (ycui2@utmem.edu). The solution will
be posted at http://compbio.utmem.edu/MSCI814/Solution2.htm
on March 23.
Data: Download the dataset from http://compbio.utmem.edu/MSCI814/Homework2.txt
(Right click on the link and select Save Target As).
The dataset contains gene expression profiles of 8 breast cancer samples
(BC1-8) and 8 ovarian cancer samples (OC1-8).
Identify the genes that are differentially expressed
between the two groups (8 breast cancer samples vs. 8 ovarian cancer samples)
using:
1.
T-test
a.
How
many significant genes are identified using the default options?
b.
What
is the name of the gene with the smallest p-value?
2.
SAM
a.
What
is the name of the gene with the largest ![]() (the absolute value
of the score (d))?
(the absolute value
of the score (d))?