Gene Ontology figures
Example
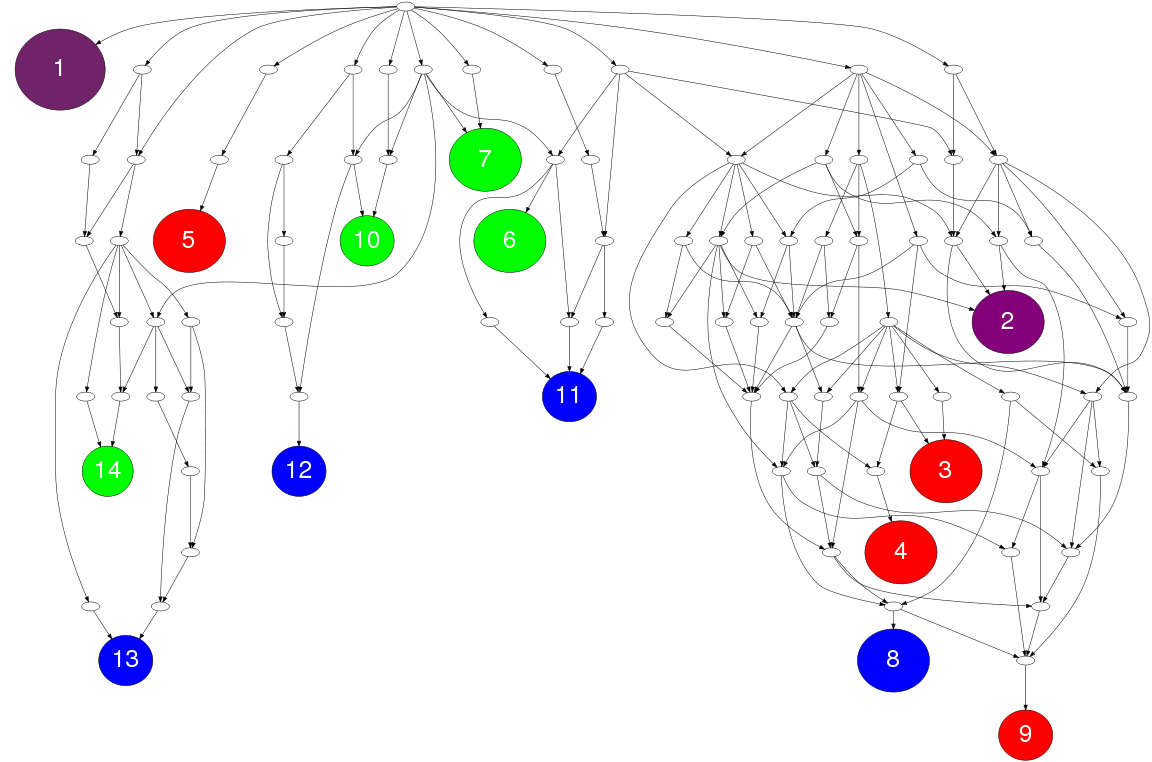
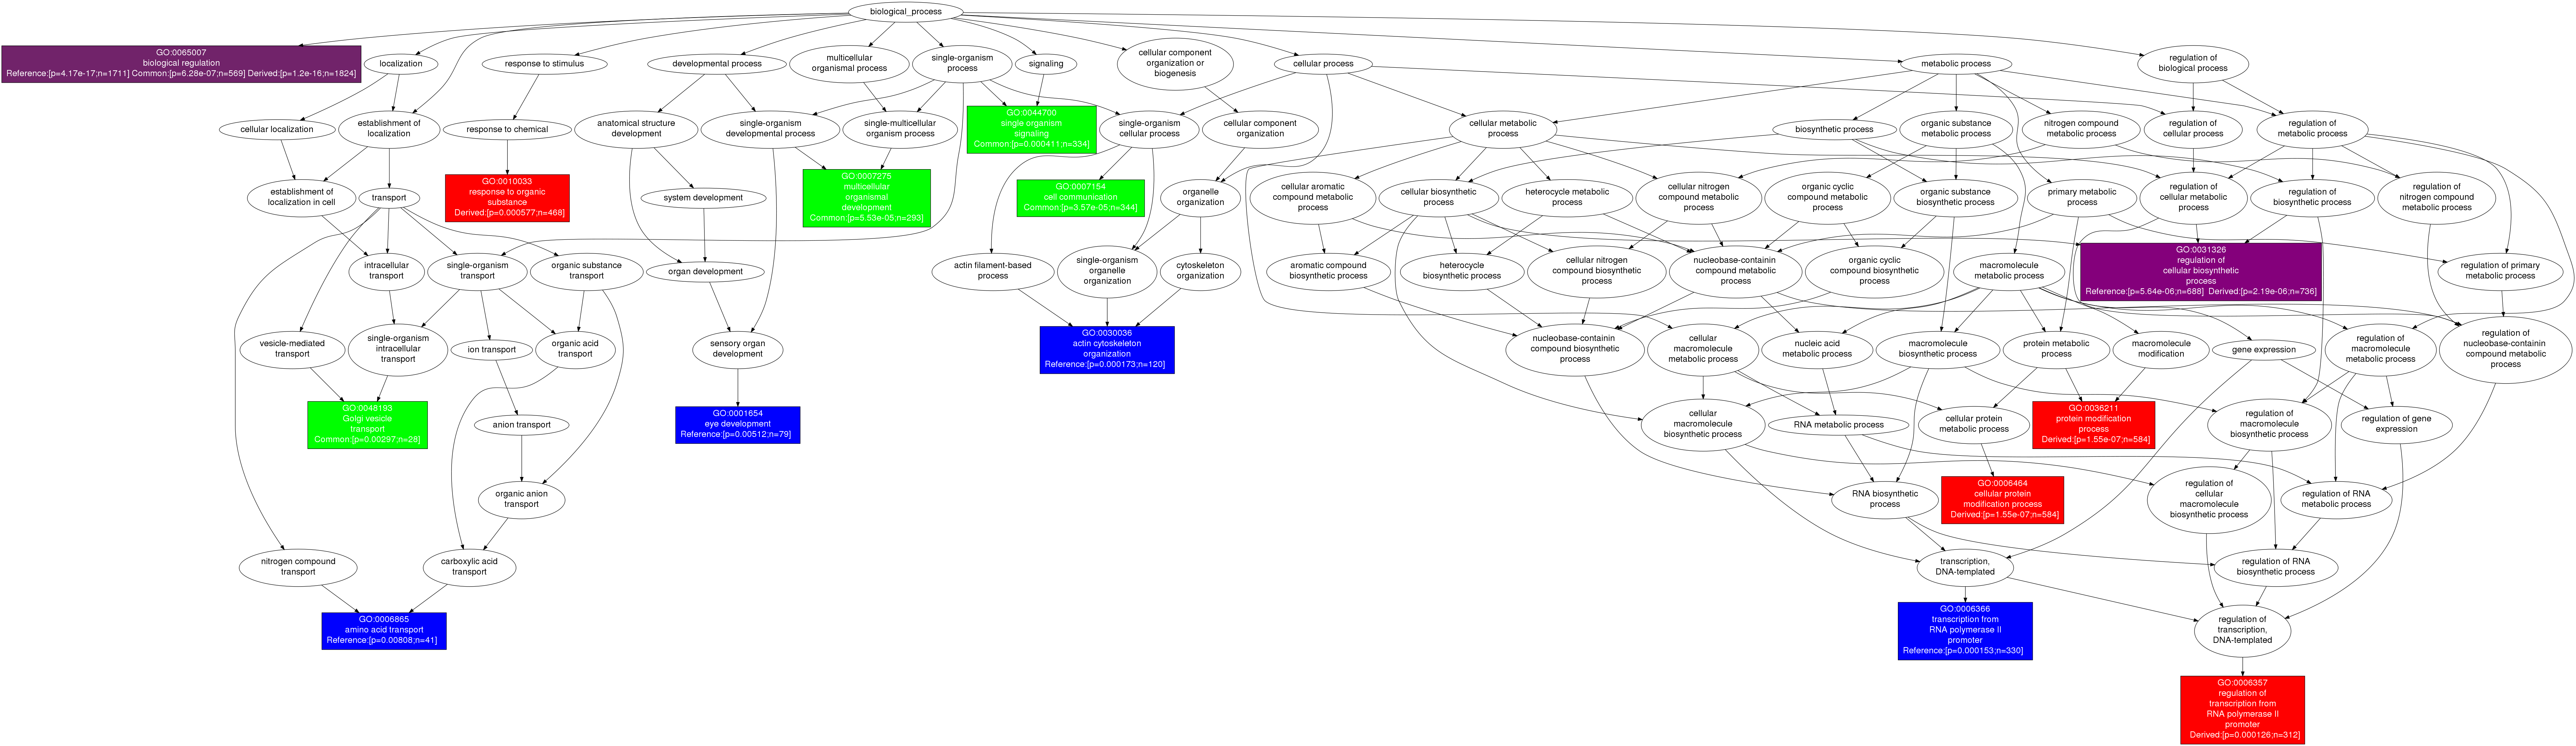
The Gene Ontology figure in the example shows the distribution of enriched GO terms in the GO hierarchy by varying the node colors for the enriched terms from reference targets (or miRNA 1 targets), derived targets (or miRNA 2 targets) and common targets.
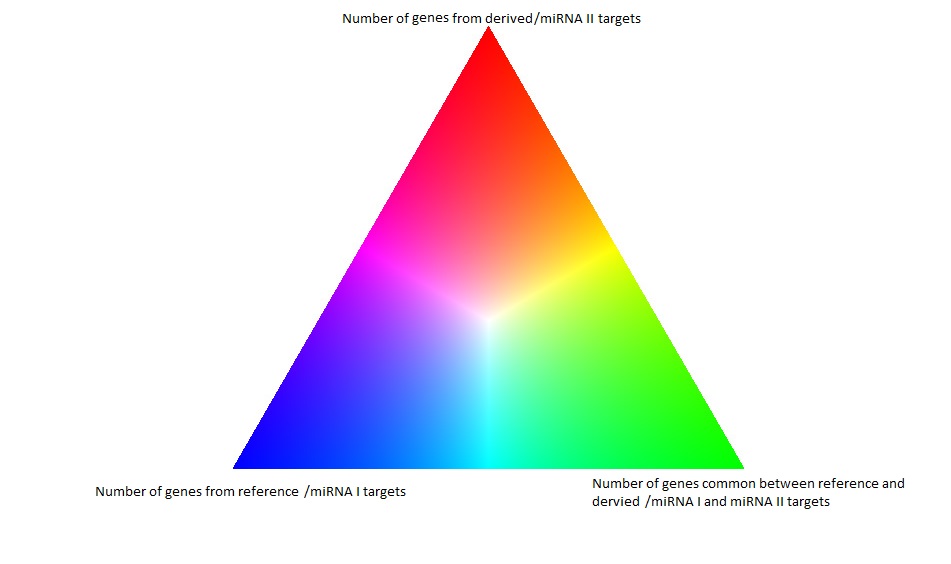
Node colors: Number of target genes for reference targets (or miRNA 1 targets), derived targets (or miRNA 2 targets) and common targets determine the "blue", "green" and "red" components of nodes color respectively. The node colors are varied for changes in the number of targets to form the color triangle. White node color has been used for nodes that does not obtain significant p-values for any target gene set.
Node sizes: The node size is determined by the total number of target genes annotated to this GO term.
Node labels: Nodes for all the functionally enriched GO terms are labeled with numbers as node ids. Starting from '1', the numbers are assigned in the ascending order of total number of genes from the miRNA target sets for the functional categories.
Node description: A table for each GO figure was prepared to list enriched GO terms, p-values and total number of target genes annotated to each enriched term.
Detailed GO figure: A detailed layout of GO figure is available where nodes are labeled with the GO terms, enrichment p-values and number of target genes.
Example