Table of Contents
- Introduction
- Algorithm
- Features
- Download and Installation
GifiArray Analyzer is distributed in 2 forms. Both of them work independently.
- GifiArray Analyzer with network database access
This version of GifiArray Analyzer is easy to install. It connects directly to the server in our lab, therefore the running speed is affected by the network bandwith and the number of users on the server.
- GifiArray Analyzer with local database access
This version of GifiArray Analyzer requires some experience with MySQL server to set up correctly.
- Running GifiArray Analyzer
- Input Data Format
- A Walk-through with Sceen Shots
- Basic Data Analysis
- Gene Ontology/MIPS Analysis
- Threashold Setting
- Other Features i.e. print, export ..
- How to cite?
- Contact Information
1. Introduction
Gifi Array Analyzer is a Java application for integrated analysis of
DNA microarray data and gene functional classification data.
1.1 Algorithm
Gifi Array Analyzer implements Homals (Homogeneity Analysis by means of Alternating Least Square).
Homogeneity analysis is a graphical, multivariate statistical method. It is the basic component of the Gifi System.
1.2 Features
Features include: interactive data visualization, integrative analysis of gene expression profiles and functional categories,
Gene Ontology Analysis, automatically downloading, parsing database source files of UniGene,
LocusLink, SGD and
Gene Ontology, and creating and updating a local relational database containing information
extracted from the database source files.
2. Download and Installation
2.1 GifiArray Analyzer with network database access
2.1.1 System Requirements:
Gifi Array Analyzer is written in Java and has been tested on Windows 2000/XP and Redhat Linux 8.0. GifiArray Analyzer requires the following software to run successfully.
- Internet access
- Java Runtime Environment (JVM) 1.4.1 or later version, which can be downloaded from
http://java.sun.com/products/archive/index.html
To find out if you have JVM on your computer and its version, run 'java --version' from a command prompt.
If it shows 'command unfound/unrecognized', you will need to download it from the above URL and install it.
2.1.2 Download GifiArray Analyzer:
- Gifi Array Analyzer for
Windows 2000/XP can be downloaded from here
- Gifi Array Analyzer for
Redhat Linux can be downloaded from here
2.1.3 Installation:
Make sure your system meets the requirements in 2.1.1.
- Download the distribution file to a directory of your choice and unzip it. You will find a subdirectory named 'GifiArray_Analyzer' created in your installation directory.
2.2 GifiArray Analyzer with local database access
2.2.1 System Requirements
Gifi Array Analyzer is written in Java and has been tested on Windows 2000/XP and Redhat Linux 8.0.
- 1 GB of disk space are required to accomodate the database and input data files.
- GifiArray Analyzer requires the following software to run successfully.
2.2.2 Download GifiArray Analyzer
- Gifi Array Analyzer for
Windows 2000/XP can be downloaded from here
- Gifi Array Analyzer for
Redhat Linux can be downloaded from here
2.2.3 Installation
Make sure your system meets the requirements in 2.2.1.
- Download the distribution file to a directory of your choice and unzip it. You will find a subdirectory named 'GifiArray_Analyzer' created in your installation directory.
- Switch to directory 'GifiArray_Analyzer' and run
Gifi_Install_xxx.bat.
- You will be prompt for the root password to your MySQL server.
3. Running GifiAray Analyzer
In the directory 'GifiArray_Analyzer', run executable Gifi_RUN_linux for Linux operation system or Gifi_RUN_win.bat for Windows operation system.
3.1 Input Data Format
GifiArray Analyzer takes 3 types of input data files, cDNA Microarray, Affymetrix and gene group data file.
There are sample data files under director GifiArray_Analyzer/data.
Your input data file should be tab-delimited text file. (Missing data is ok.)
- cDNA Microarray data file format
|
Accession
|
EXP1
|
EXP2
|
EXP3
|
EXP4
|
EXP5
|
...
|
|
Gene1
|
data
|
data
|
data
|
data
|
data
|
...
|
|
Gene2
|
data
|
data
|
|
data
|
data
|
...
|
|
Gene3
|
data
|
data
|
data
|
data
|
|
...
|
|
Gene4
|
|
data
|
data
|
data
|
data
|
...
|
|
Gene5
|
data
|
data
|
data
|
data
|
data
|
...
|
|
...
|
...
|
...
|
...
|
...
|
...
|
...
|
The 1st column is Genebank accession number or yeast systematic ORF name.
- Affymetrix data file format
|
Probe set
|
Accession
|
EXP1
|
EXP1 call
|
EXP2
|
EXP2 call
|
...
|
|
AFFX-..._at
|
Gene1
|
data
|
data
|
data
|
data
|
...
|
|
AFFX-..._at
|
Gene2
|
data
|
data
|
data
|
data
|
...
|
|
AFFX-..._at
|
Gene3
|
data
|
data
|
data
|
data
|
...
|
|
AFFX-..._at
|
Gene4
|
data
|
data
|
data
|
data
|
...
|
|
AFFX-..._at
|
Gene5
|
data
|
data
|
data
|
data
|
...
|
|
...
|
...
|
...
|
...
|
...
|
...
|
...
|
The 1st column is Probe set, the 2nd column is Genebank accession number or
yeast systematic ORF name, the 'call' column contains one of the three characters, A(Absent), P(Present) and M(Marginal).
- Group Gene data file
A Gene group file is a 2-column, tab-delimited text file. The first column is the group id, and the second column is gene name.
A group id can be a number or a letter. Genes in the same group should stay together, for example:
| Correct |
Wrong |
| 0 |
YGR214W |
| 0 |
YGR148C |
| 1 |
YDR418W |
| 1 |
YLR388W |
| 2 |
YGL031C |
| 2 |
YGL123W |
|
| 0 |
YGR214W |
| 1 |
YDR418W |
| 0 |
YGR148C |
| 2 |
YGL031C |
| 1 |
YLR388W |
| 2 |
YGL123W |
|
3.2 Walk-through using sample input data
GifiArray Analyzer should be run under the directory 'GifiArray_Analyzer'.
3.2.1 Basic Analysis
-
Double click on
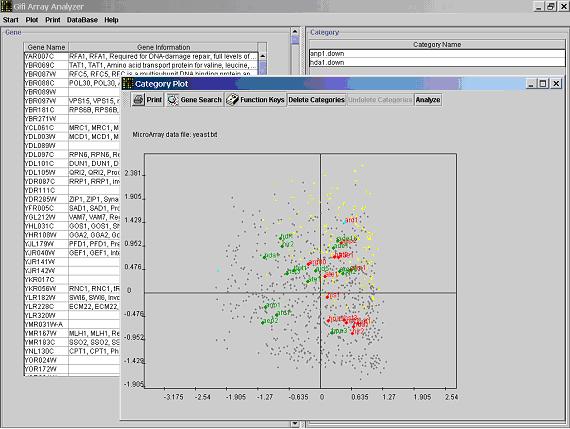
Gifi_RUN_xxx.bat, you should see a window popped up on your screen like this:
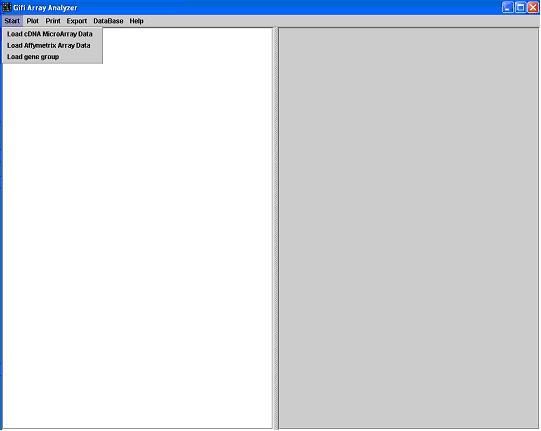
-
Click on
Start, choose Load microarray data and you will see another window popped up
for you to select your data file and enter relevant criteria.
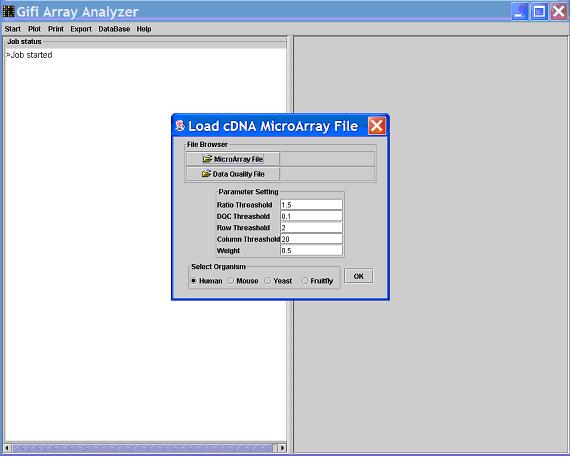
- Click
Open Microarray File, select GifiArray_Analyzer\data\cDNA.txt, select organism Yeast,
in Ratio Threshold type in 1.5, keep eveything else the default value, and click on OK.
For more information about threashold setting , please refer to 3.2.3 Threashold Setting
It will take a few minutes, depend on the speed of your CPU, for the following window to be shown.
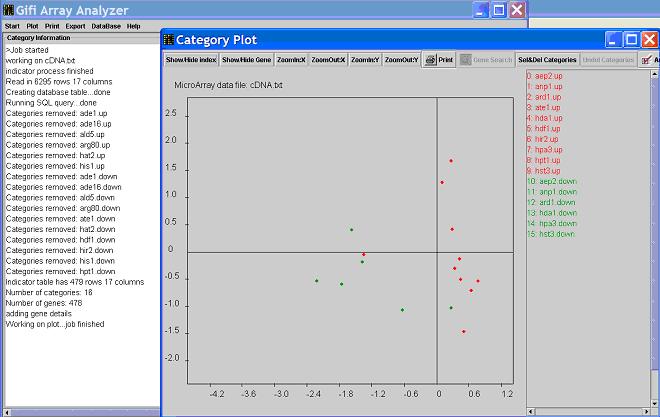
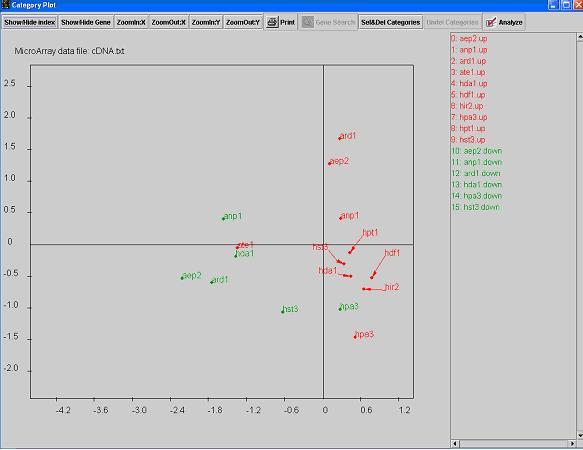
- Clicking on
Show/hide index will allow you to see the indexes of the functional categories.
Keep clicking on this button, you will see alternative names of the categories.
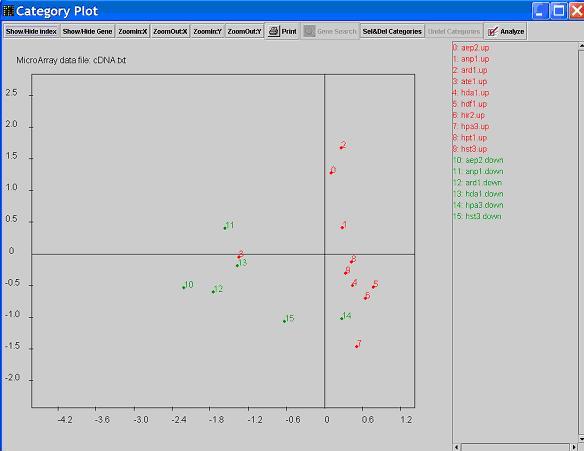
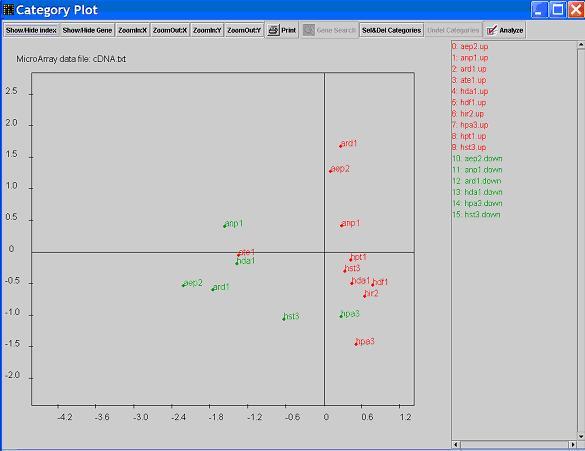
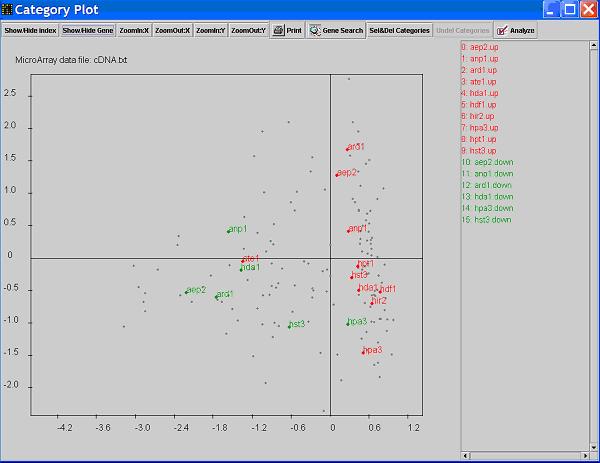
- Click on button
Show/hide Gene will show/hide the genes in the functional categories on the graph.
The genes are identified by smaller dots than the category dots.
A gene dot may represent one gene or a group of genes that have the same response pattern (i.e. similar expression profile,
in this case, it is actually a kind of gene clustering).
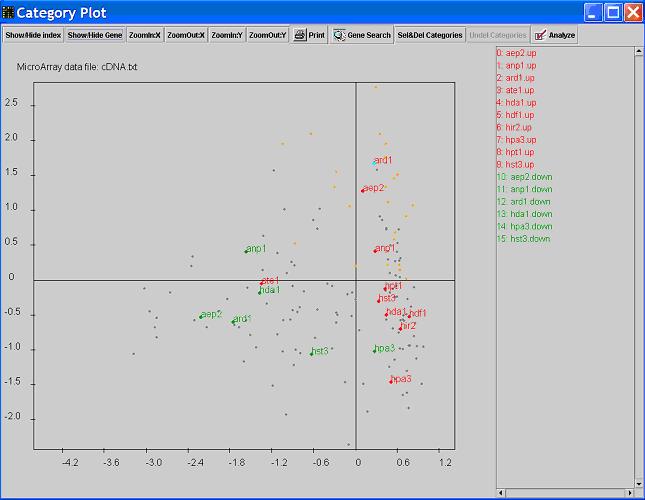
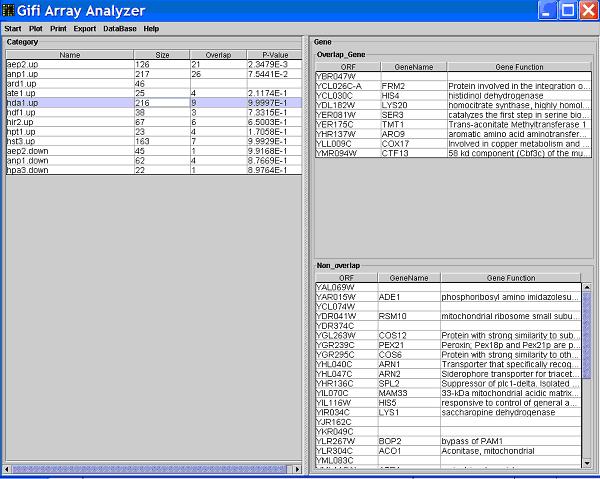
- When you see the
Analyze button is checked, you are in the Analyze mode,
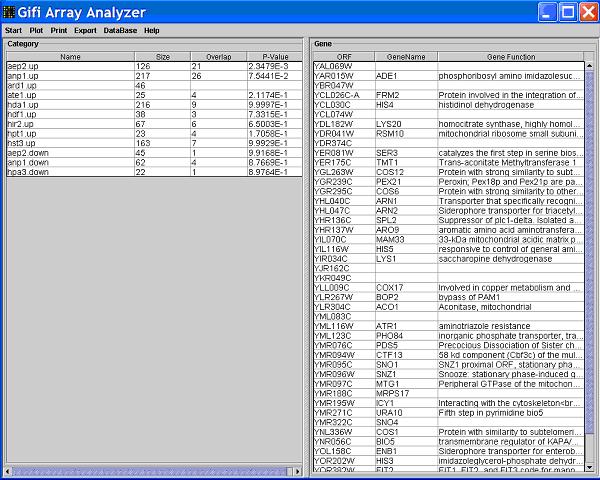
which means more detailed information about a category or gene can be viewed. Click on a certain category dot, the category and the genes in that category will be highlighted on the graph. At the same time, details about that category will be shown in the main window.
All the categories that contain genes that also belong to the clicked category will be listed in the left table.
Information includes: the category size; size of the intersection set (i.e. contains how many genes that also belong to the clicked category);
P-value calculated by using hypergeometric distribution, which is used to check if (and to what extend) a category is enriched by the genes
belong to the clicked category. Calculating P-value is time-consuming, please wait. The functional information of the genes that belong to
the clicked category will be displayed on the right side of the main window.
Click a category in the left table, you will see the right table divided into two tables, the upper table contains genes that belong
the intersection set of the two clicked categories.
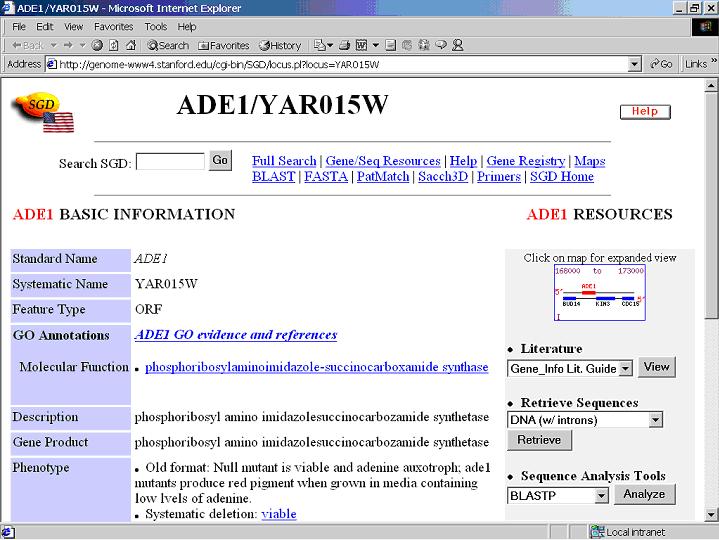
Click a gene in the right table, Internet Explore in Windows or Mozilla in Redhat Linux will be launched
(if failed, check if your IE is installed under "C:\Program Files\Internet Explorer" in Windows) and directly go to a web database
(GeneCards for Human genes, LocusLink for Mouse genes, SGD for Yeast genes) to search information of the clicked gene.
- Often times, the category dots are very close to each other and their indexes are overlapped. You can
drag the indexes away to make
the graph more legible using the right key on your mouse. Right click on the dot or the index, hold the mouse key,
release it at a desired location. An arrow will be shown to connect the dot and the dragged index.
- Click the
gene search button, input the Genebank accession number, or gene name or Unique Gene ID (case sensitive).
The dot that represent the selected gene will be highlighted in the graph.
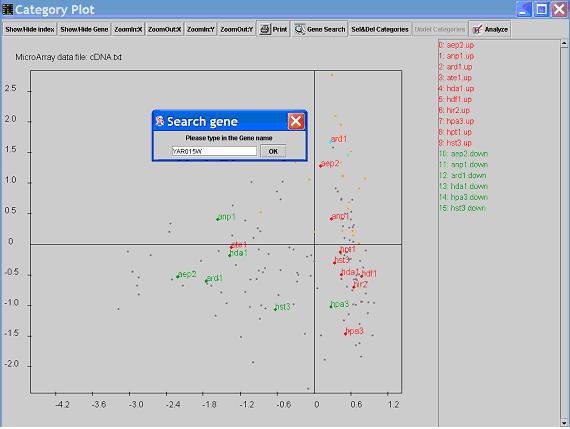
Click on a gene dot to view the group of genes with the same response pattern in the main window.
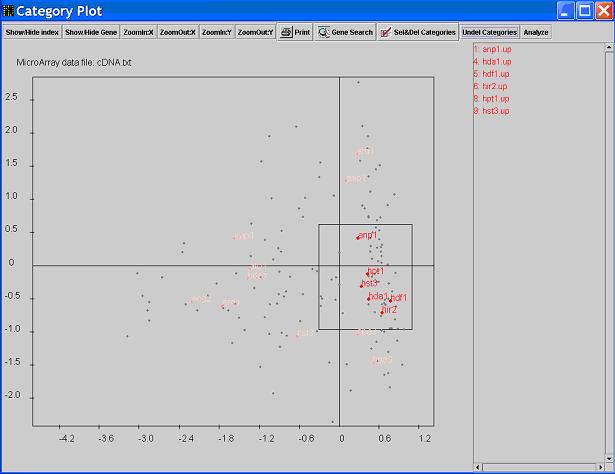
- Click the
Sel/Del Categories, you will be in the Delete mode. You can click on the category
points you want to remove, the clicked point will change to pink color. Mouse drag can be used to select more than one point at a time.
After click your mouse at some place and release at some other place, the points outside the rectangular area covered by these two spots
will be deleted. In other words, your mouse drag will keep the points within the dragging area and delete all others.
You can press Undelete Categories to retrieve all the deleted categories. To undelete a single category,
you just need to click on that point again. Retrieved points are showing their original color instead of pink.
Click plot->update plot in the main menu, to see an updated plot. If you want to go back to the original plot,
click plot-> get original plot in the main menu.
3.2.2 Gene Ontology/MIPS Analysis
- After getting the plot, you can do Gene Ontology analysis by clicking
Database->Gene Ontology Analysis in the main menu.
The program will run a SQL query and display a new window containing Gene Ontology information including Gene Ontology IDs,
Gene Ontology Terms and how many genes in your dataset (after filtering) belongs to each category.
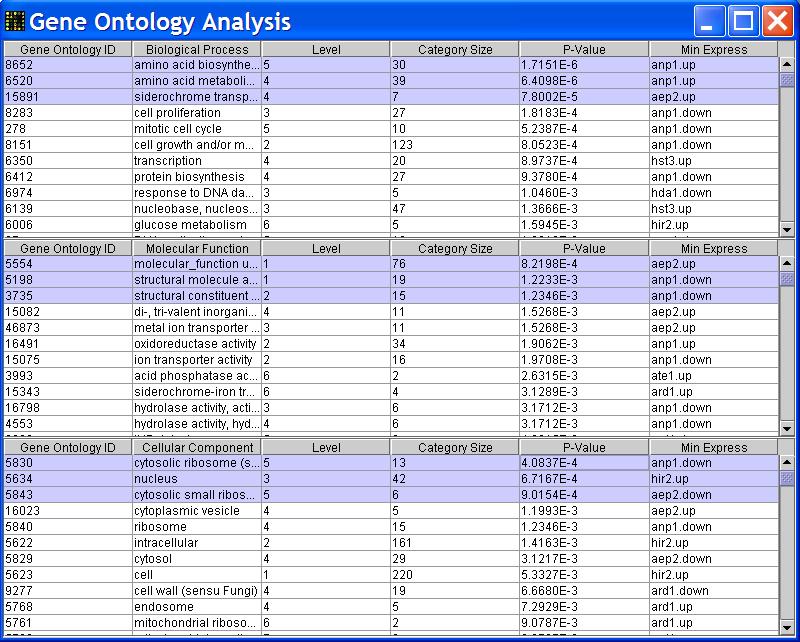
This Gene Ontology Information table is sortable by table column. To sort the table, you need to click on the header cell of the column that you
want to sort by. The sorting order can be changed by clicking on the header cells more than once.
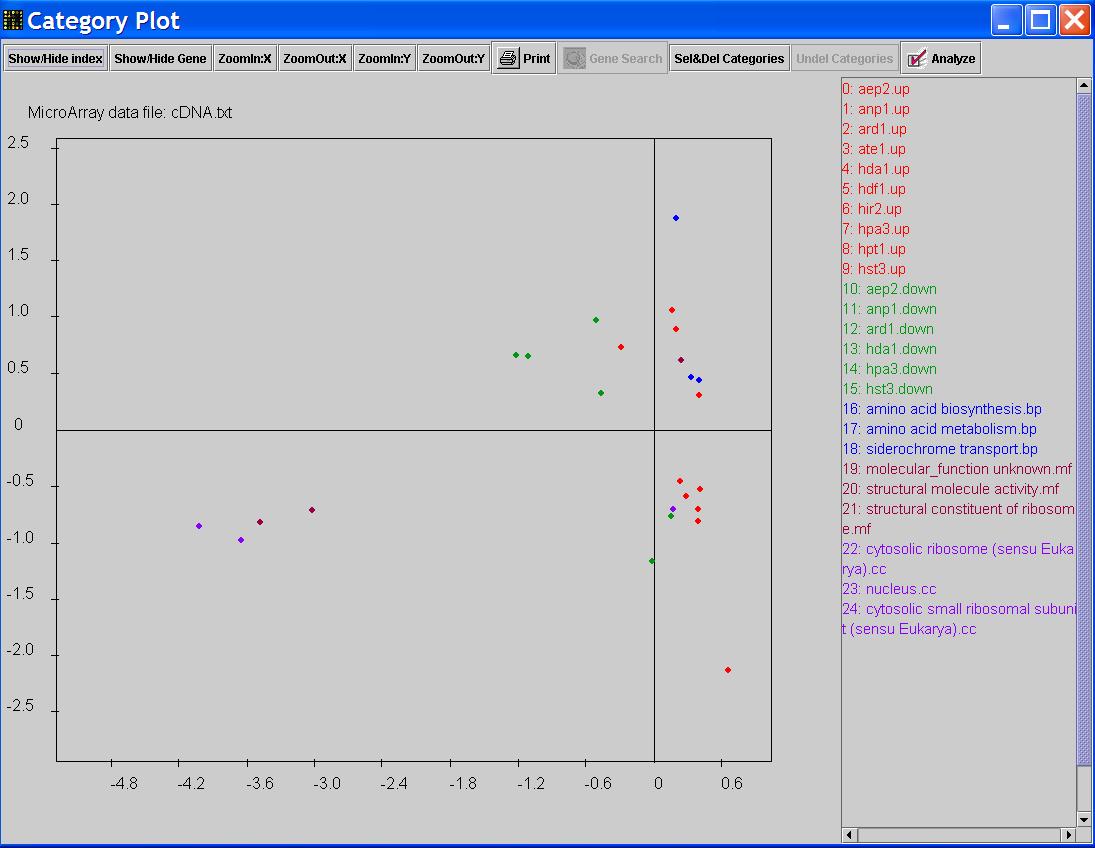
Now you can select the functional categories and add them to the graph by using 'Shift/Crtl' and mouse click.
When you finished your selection, go to the main menu, click on Plot-> Add Functional Categories.
New points representing Gene Ontology categories will be added to the graph.
MIPS Analysis is similar to Gene Ontology Analysis. Click on Database->MIPS Analysis from the main menu.
The rest steps are the same as in Gene Ontology Analysis.
3.2.3 Threashold setting:
The input data are supposed to be log-ratios.
- The default
ratio threshold (for selecting differentially expressed genes) is 1(=log2(2.0)).
Row threshold (r_th) is used to filter genes that are not differentially expressed in at least r_th samples. The default value is 2.
Column threshold (c_th) is used to filter categories that contain too few genes. The default value is 20 (e.g. if a category contains less than 20 genes it will not be included in the analysis).
Weight is the relative proportion of expression categories and functional categories, the range is (0, 1).
If you do not want the structure of the data to be effected dramatically by adding functional categories,
you should use large weight (for example 0.9).
3.2.4 Other features:
Zoom: Graph can be zoomed in and out on both X and Y axis;
Print: Tables and graph can be printed directly to your default printer;
Data Export: Graph image and table content can be saved to your local hard disk;
4. How to cite Gifi Array Analyzer
To reference Gifi Array Analyzer, please cite this paper:
Yan Cui, Mi Zhou, Wing Hung Wong (2004) Integrated Analysis of Microarray Data and Gene Function Information. OMICS A Journal of Integrative Biology,
Vol.8, No.2 106-117
Manuscript
5. Contact information
Gifi Array Analyzer is developed by Yan Cui's lab at University
of Tennessee Health Science Center and Wing Wong's lab at Harvard University.
Term of Use: Gifi Array Analyzer can be freely
downloaded for academic, non-commercial use only.
This software is provided "AS IS". There is no warranties,
express or implied on it.
Thank you for using Gifi Array Analyzer.